
Figure 6. Preclinical Efficacy of Combined XPO1 and AKT Inhibition in AML.
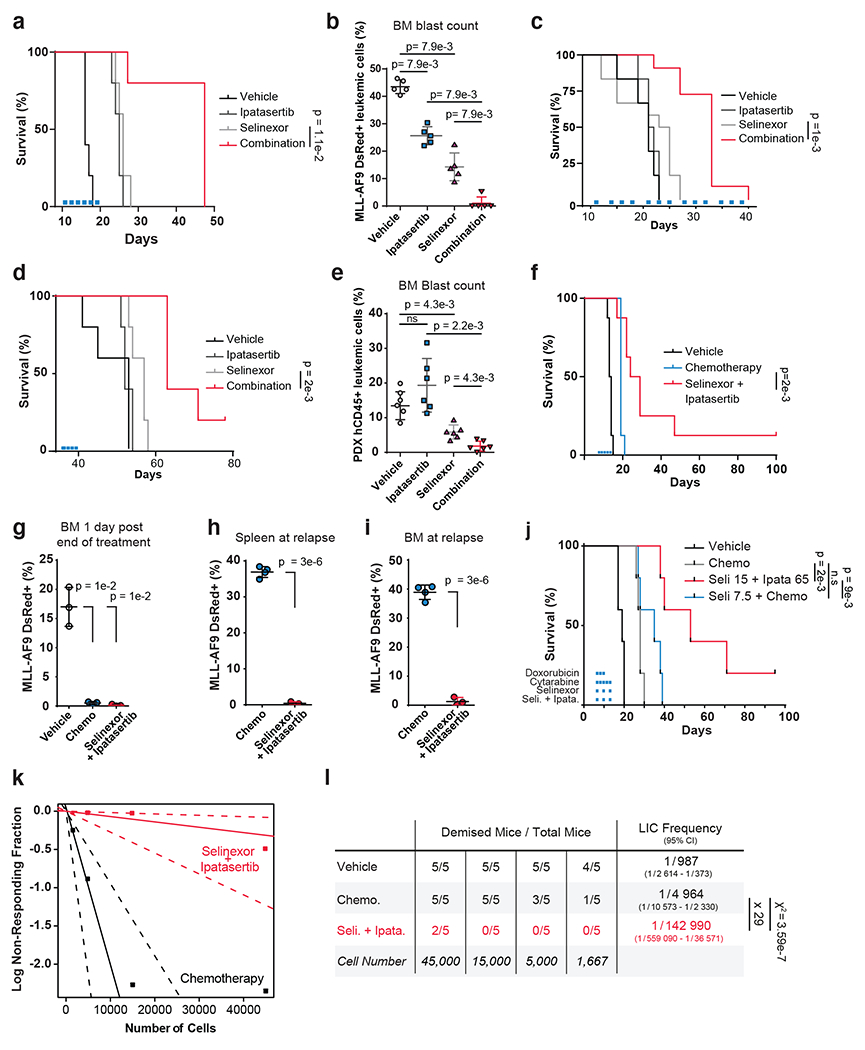
a, c-d) Kaplan–Meier survival curves of MLL-AF9 syngeneic (a), OCI-AML2 cell-line NSG xenograft (c) or patient-derived AML-engrafted NOG-EXL (d) mouse models treated with vehicle, 65mg/kg ipatasertib, 15mg/kg selinexor or the drug combination; n = 5 (a,d),n=10 (c), mice per cohort.
b) FACS quantification of MLL-AF9 dsRed+ leukemic blast cells mouse bone marrow aspirates (n=5 biologically independent mice per group) following treatment with conditions indicated in (a).
e) FACS quantification of human CD45+ leukemic blast cells from NOG-EXL mouse bone marrow aspirates (n=6 biologically independent mice per group) on day 28. Human CD45+ cells were injected on day 0; engraftment was confirmed on day 12; mice were treated day 13 through day 21
f) Kaplan–Meier survival curves of MLL-AF9 syngeneic mouse model of AML treated with vehicle, standard-of-care chemotherapy (1mg/kg doxorubicin and 100mg/kg cytarabine) or the combination of 65mg/kg ipatasertib plus 15mg/kg selinexor; n = 8 mice per cohort.
g) FACS quantification of MLL-AF9 dsRed+ leukemic blast cells from mouse bone marrow aspirates following treatment with conditions indicated in (f); n = 3 biologically independent mice.
h) FACS quantification of MLL-AF9 dsRed+ leukemic blast cells in spleen upon disease relapse following standard-of-care chemotherapy (1mg/kg doxorubicin and 100mg/kg cytarabine) versus the 65mg/kg ipatasertib plus 15mg/kg selinexor drug combination; n = 4 biologically independent mice in control and n= 3 selinexor + ipatasertib.
i) FACS quantification of MLL-AF9 dsRed+ leukemic blast cells in bone marrow with conditions indicated in (h); n = 4 biologically independent mice in control and n= 3 selinexor + ipatasertib.
j) Kaplan–Meier survival curves of MLL-AF9 syngeneic mouse model of AML treated with vehicle, standard-of-care chemotherapy (1mg/kg doxorubicin and 100mg/kg cytarabine), the combination of chemotherapy plus 7.5mg/kg selinexor, or the combination of 65mg/kg ipatasertib plus 15mg/kg Selinexor conducted with n = 5 mice per cohort.
k) Limiting dilution assay performed on MLL-AF9 cells isolated from primary mice treated with either standard chemotherapy (100mg/kg cytarabine and 1mg/kg doxorubicin) or the combination of 15mg/kg selinexor and 65mg/kg ipatasertib for 24hrs and reinjected into secondary recipient mice with n=5 biologically independent replicates per cohort.
l) Determination of leukemia-initiating cell (LIC) frequency with a 95% confidence interval in each group using extreme limiting dilution analysis (ELDA). Statistical significance determined by a two-sided chi-squared test.
Figure 6 b,e, g–i Data are presented +/− s.d. P-values calculated using nonparametric Mann-Whitney test (b, e) or two-tailed Welch’s t-test (g-i).
Figure 6 a,d,f,j Statistical significance determined by log-rank (Mantel-Cox) test. Duration treatments conditions depicted as colored bars.