
Extended Data Fig. 1. CRISPR/Cas9 and RPPA analyses reveal signaling pathways modulated by Selinexor treatment.
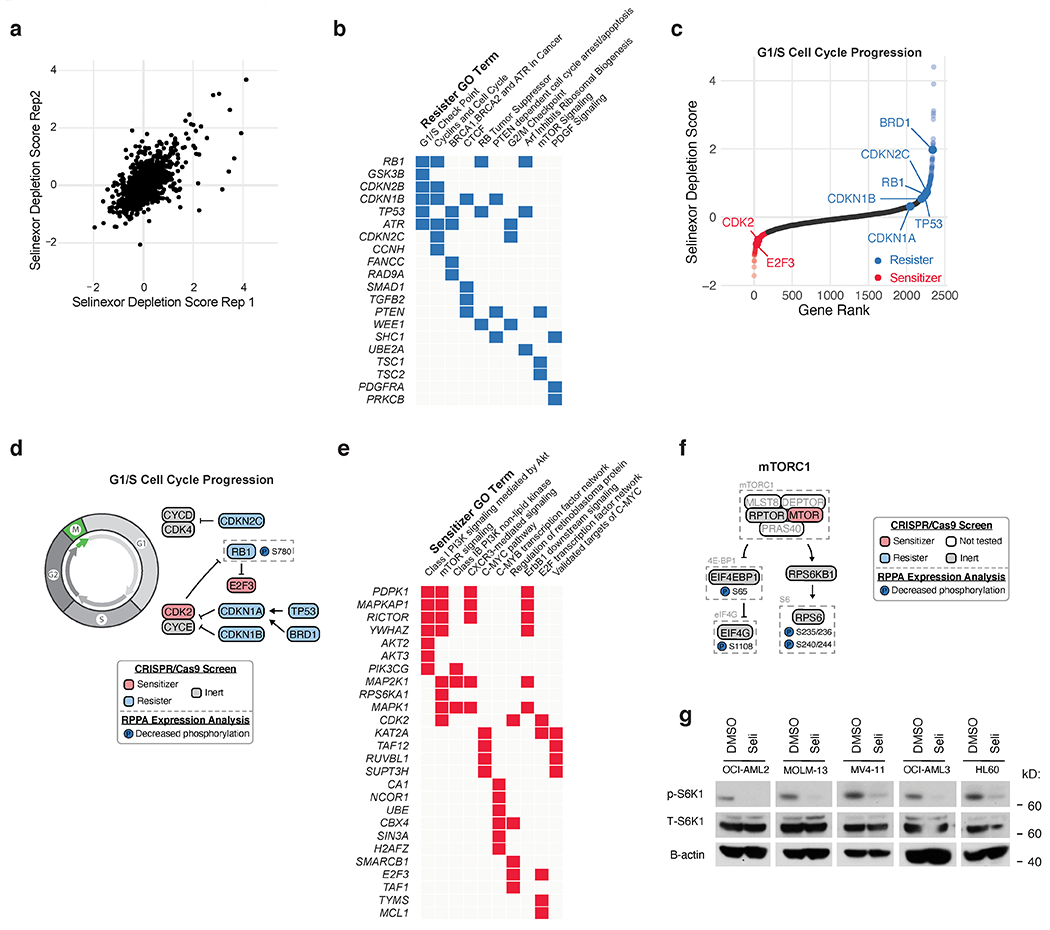
a) Scatterplot depicting replicate selinexor depletion gene scores from CRISPR/Cas9 drug-modifier screen. Screens conducted as n = 2 independent replicates with n = 5 sgRNAs per gene.
b) Gene ontology (GO) analysis of selinexor “resister” genes; performed using Enrichr.
c) Selinexor depletion gene scores ranked from most depleted to most enriched in the selinexor versus vehicle treated populations. Predicted genetic modifiers of selinexor sensitivity involved in G1/S cell cycle progression are annotated.
d) Schematic relating G1/S cell cycle regulators to selinexor depletion gene scores and RPPA expression. Annotated as in Fig. 1d.
e) GO analysis of selinexor “sensitizer” genes; performed using Enrichr.
f) Schematic relating mTORC1 signaling to selinexor depletion gene scores and RPPA expression. Annotated as in Fig. 1d.
g) Immunoblot depicting protein levels of phosphorylated and total S6K1 in five AML cell lines treated with DMSO or selinexor. B-actin included as loading control. Representative immunoblots of n = 2 independent experiments yielding similar results.