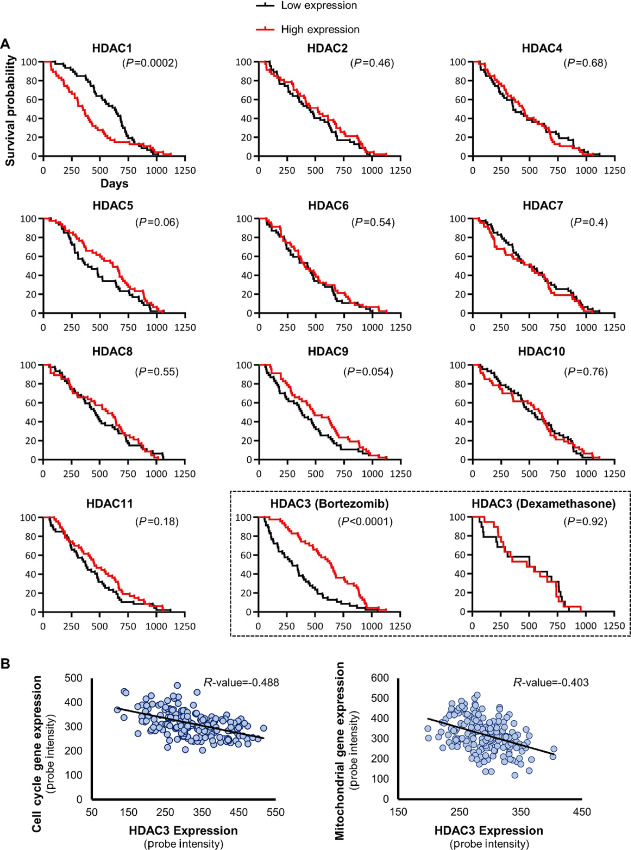
FIGURE 3.
Tumor-suppressive effects of HDAC3 in primary multiple myeloma in combination with proteasome inhibitors. A, Kaplan-Meier representation of overall survival times of relapsed multiple myeloma participants enrolled in the APEX phase II and phase III clinical trial (4, 28) were compared on the basis of individual expression levels of 11 class I, II, and IV HDACs. Survival of patients expressing each HDAC ranked in the top versus bottom quarter was compared in the cohort receiving bortezomib treatment only. The two histone deacetylases that correlated significantly with overall survival in multiple myeloma were HDAC1, with a potentially oncogenic effect, and HDAC3 with a potentially suppressive effect. Notably, HDAC3 only correlated with better outcomes when expressed in the top quartile of the patient population that was subsequently treated with proteasome inhibitor bortezomib, not in patients in the dexamethasone control arm (black dashed box). In the dexamethasone cohort, the median survival time was 504 days and 481 days for the low expression and the high expression group, respectively. In the bortezomib cohort, the median survival time was 300 days and 641 days for the low expression and the high expression group, respectively. Results of the cohort receiving dexamethasone are not represented for the other HDACs. The transcript levels of HDAC genes were determined based on a DNA microarray study in primary CD138+ multiple myeloma cells (4, 28). The indicated P values were calculated with the Gehan–Breslow–Wilcoxon test and significance was verified with the log-rank test. B, Scatter diagram showing the anticorrelation between HDAC3 and cell cycle (left) or mitochondrial (right) gene expression in patients with multiple myeloma. A previously published DNA microarray study (4, 28) was analyzed to determine expression levels of the selected genes in primary CD138+ multiple myeloma cells. The human mitochondrial gene list was downloaded from the MitoCarta 3.0 database (43). The Pearson correlation coefficient (R value) is indicated for each scatter plot. The values of the x- and y-axis are RMA normalized Affymetrix probe intensity.

