FIGURE 4.
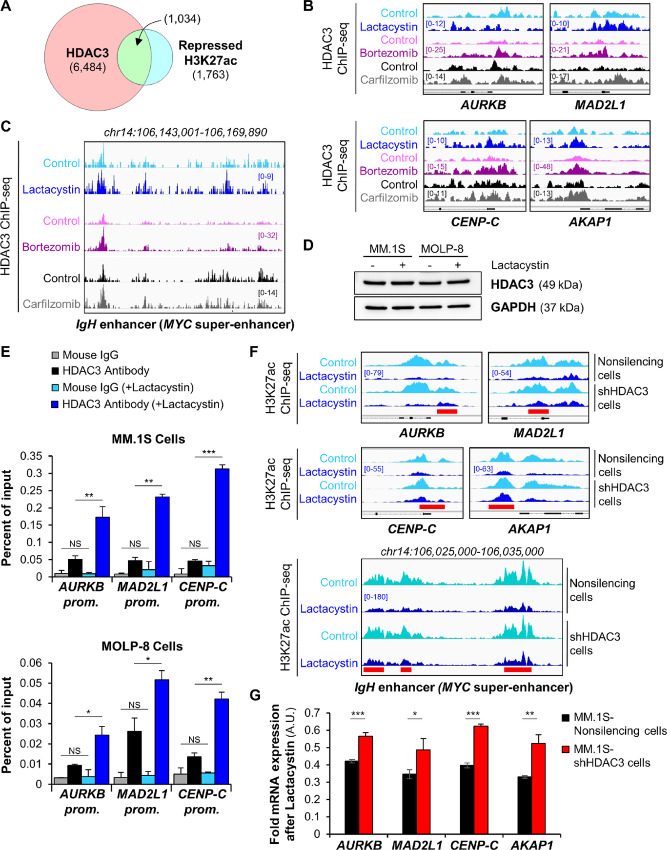
DNA site–specific stabilization of HDAC3 by proteasome inhibition. A, Venn diagram shows the overlap of HDAC3-associated sites and repressed H3K27 acetylation sites within 1 kb of transcription start site after treatment of MM.1S cells with proteasome inhibitors. Repressed acetylation sites were defined as overlapping H3K27ac sites which were reduced by all three treatments shown in Fig. 1E. B, Representative IGV browser ChIP-seq tracks of HDAC3-associated binding sites in MM.1S cells show elevated HDAC3 DNA occupancy at the promoters of cell-cycle and mitochondrial genes following proteasome inhibitor exposure. All IGV tracks in a given comparison are represented at the same scale (numbers in brackets at the y-axis). The gene structure is shown in black at the bottom of each panel. The genomic region on the x-axis spans 2.5 kb for all the genes. IGV snapshots are representative of two independent experiments. C, Gene tracks of HDAC3 ChIP-seq occupancy at the c-MYC super-enhancer in MM.1S cells following exposure to proteasome inhibitors. The HDAC3 sites that show marked increase of DNA occupancy levels within the super-enhancer matched with the H3K27 acetylation sites that are the most repressed following treatment (see Fig. 2D). IGV tracks in a given comparison are represented at the same scale (numbers in brackets at the y-axis). The genomic region on the x-axis spans 25 kb of the c-MYC super-enhancer. IGV snapshots are representative of two independent experiments. D, Western blot analysis of HDAC3 expression levels in MM.1S cells and MOLP-8 cells shows that proteasome inhibition does not affect global cellular levels of HDAC3 protein after treatment with 6 μmol/L or 0.5 μmol/L lactacystin for 6 or 24 hours, respectively. GAPDH was used as an internal control. E, HDAC3 was locally stabilized following proteasome inhibition. ChIP-qPCR analysis of HDAC3 DNA occupancy at selected promoters following proteasome inhibition with lactacystin in MM.1S cells (top) and MOLP-8 cells (bottom). NS, not significant; ***, P < 0.001; **, P < 0.01; and *, P < 0.05 determined by unpaired Student two-tailed t test. F, H3K27 acetylation is sensitive to proteasome inhibition and HDAC3 expression. Representative IGV browser ChIP-seq tracks of H3K27ac peaks following lactacystin exposure of MM.1S-shHDAC3 knockdown cell line compared with scrambled control demonstrates that loss of H3K27 acetylation following proteasome inhibition is mediated by HDAC3 and attenuated in HDAC3 knockdown cells. The red bars indicate regions in which the flattening of the H3K27 acetylation landscape by proteasome inhibitors is attenuated by HDAC3 knockdown. Peaks are more accentuated in knockdown cells and summits are up to 40% higher. For each gene panel, all IGV tracks are represented at the same scale (numbers in brackets at the y-axis). The gene structure is shown in black at the bottom of each panel. The genomic region on the x-axis spans 2.5 kb for the four genes in the top panel. IGV snapshots are representative of two independent experiments. G, Transcriptional repression by proteasome inhibitors is attenuated in HDAC3 knockdown cells. qRT-PCR analysis of cell-cycle and mitochondrial genes after 6-hour treatment of MM.1S-shHDAC3 or scrambled control cells with 6 μmol/L lactacystin. ***, P < 0.001; **, P < 0.01; and *, P < 0.05 determined by unpaired Student two-tailed t test.

