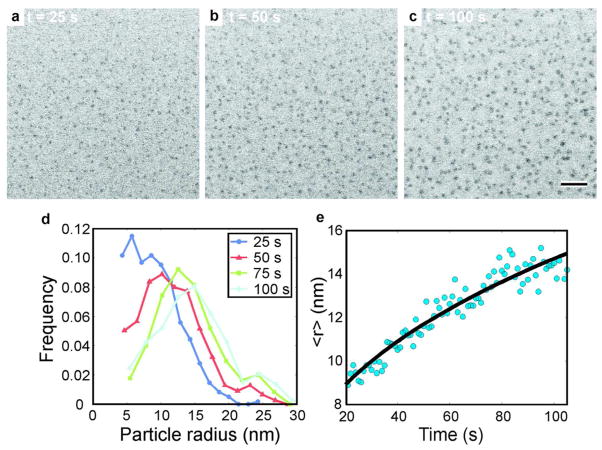
Figure 1.
(a)–(c) Time lapsed series of BF-STEM images showing growth of an ensemble of silver nanoparticles starting at 25 seconds from the initial irradiation (20 pA beam current). The scale bar in (c) is 200 nm. (d) Particle size distribution (PSD) of the ensemble for various times; the PSD’s are normalized by their total integral to yield a probability density function. (e) Mean nanoparticle radius as a function of time. The black line is the result of a power law fit of the form <r> = Kt<β>, where linear regression yielded <β> = 0.31 ± 0.01.

