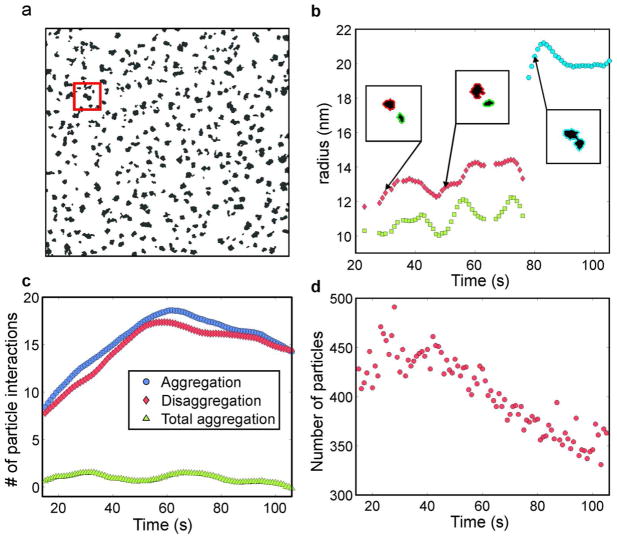
Figure 2.
(a) Black and white rendering of the BF-STEM image at t = 105 s, where nanoparticles are in black, showing the morphology of individual nanoparticles and aggregates obtained through nanoparticle tracking. (b) Growth of silver nanoparticles (marked in red box in Figure 2a) by monomer attachment and aggregation. Insets show the particle morphologies at various time points before and after aggregation, which occurred at t = 78 s. Data are filtered using a 5 second running filter to reduce noise. (c) Number of particle interactions (aggregation, disaggregation) as a function of time. The data are filtered using a 20 second running filter to reduce noise. (d) Number of nanoparticles in the ensemble as a function of time.

