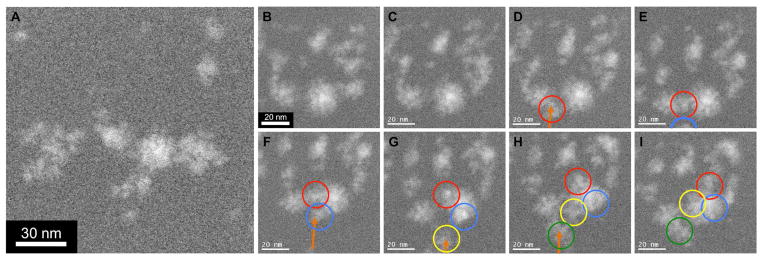
Figure 6.
(A) DF STEM image from partially ascorbate reduced Pd salt/Brij 56 paste showing clusters and loose networks of Pd, x1.2M magnification. (B–I) DF STEM images of cluster migration and agglomeration over 160 second time period (same region as A), x2M magnification. Individual clusters are circled to track motion over time (each migrating cluster given a different color: red, blue, yellow, and green). Orange arrows indicate path of migrating clusters from outside the field of view into the viewing area. Figures B–C are separated by a 40-second interval, while C–I are separated by 20-second intervals.

