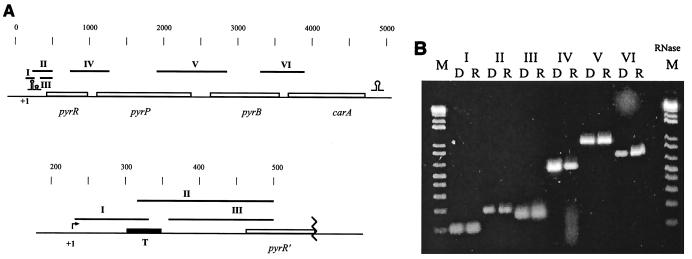
FIG. 2.
RT-PCR analysis of the transcription products of the pyrRPB-carA region. (A) Genetic map with the expected PCR products. Black box (T), putative terminator in the attenuator. Omega-like and double-omega-like structures are as defined for Fig. 1. (B) Agarose gel electrophoresis of the products obtained by the PCRs. Lanes R, results of the RT-PCR amplifications using RNA extracted from L. lactis; lanes D, standard PCRs with chromosomal DNA using the same primers. The following primers were used: I, PyrR_F4 and PyrR_4R; II, PyrRB_2F and PyrR_3R; III, PyrR_F5 and PyrR_3R; IV, PyrRB_3F and PyrRPintR; V, PyrP_F2 and PyrB_12R; VI, PyrB2 and CarA_R6. Marker (M), 100-bp DNA ladder; lane RNase, result of RT-PCR amplification with primers used in lanes VI after treatment of the RNA with RNase.

