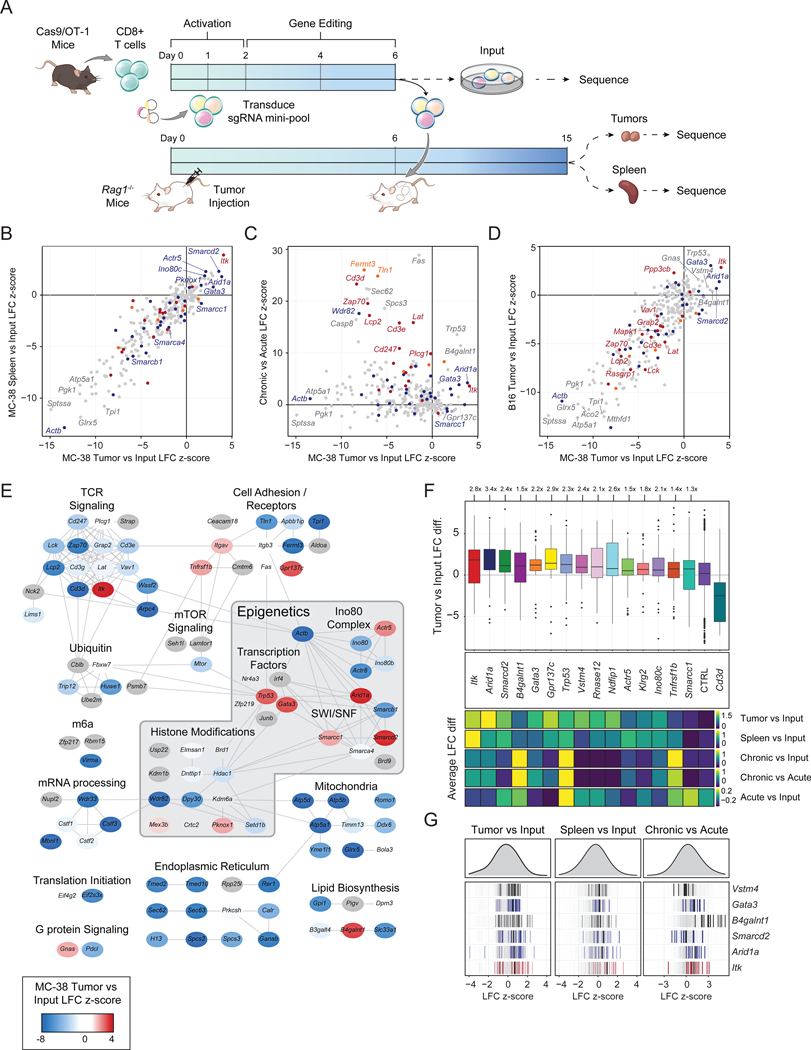
Figure 3: Targeted in vivo screening identifies subunits of the INO80 and BAF complexes that limit T cell persistence.
(A) Diagram of in vivo pooled CRISPR screening. (B) Correlation of tumor LFC z-scores to spleen LFC z-scores, colored by functional category. (C) Correlation of in vivo z-score and in vitro z-scores for genes in the CRISPR mini-pool. (D) Correlation of in vivo MC-38 and B16 tumor z-scores for genes in the CRISPR mini-pool. (B-D) Results shown are merged from 3 mice per tumor model (n=6 tumors, n=3 spleens). (E) Cytoscape protein-protein interaction network colored by z-score in MC-38 tumors. (F) Top: Boxplot of MC-38 tumor versus input log fold change for each sgRNA targeting the indicated gene, with the mean control log fold change subtracted. Bottom: heatmaps showing the sgRNA average of the indicated in vivo or in vitro screen for the same hits. Box plots show 25th, 50th (median), and 75th percentiles with outliers shown as dots. Each dot represents one sgRNA-replicate, n=36 per target gene. (G) Individual sgRNA-replicate z-scores for six top hits showing the MC-38 Tumor vs Input comparison (left, n=36), MC-38 Spleen vs Input (center, n=18), and in vitro Chronic vs Acute (right, n=12). See also Figure S6 and Tables S2–3.

