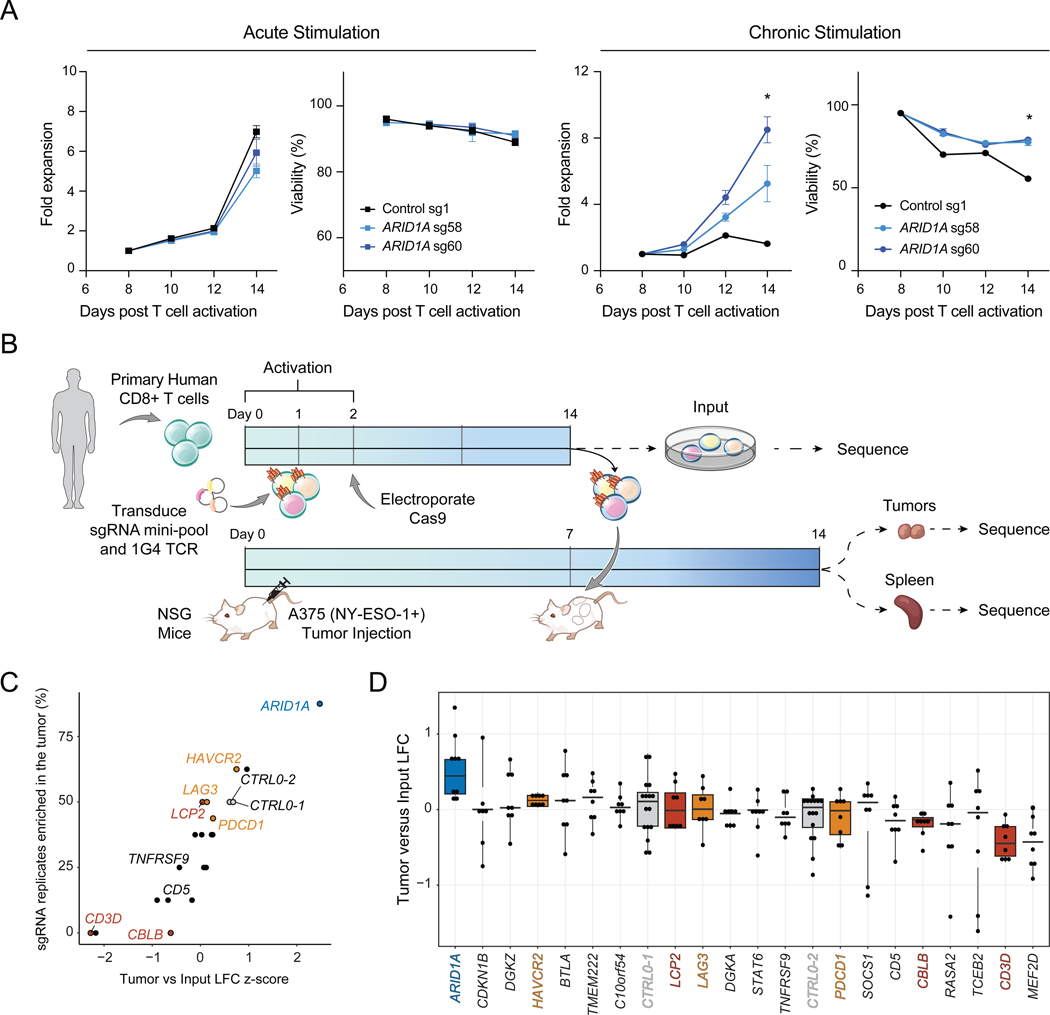
Figure 5: Conserved function of ARID1A in human T cells in vitro and in vivo.
(A) Proliferation and viability of primary human T cells after electroporation of the indicated RNP. Left: Acutely stimulated T cells. Right: Chronically stimulated T cells using anti-CD3-coated plates. Data shown is representative of 3 independent experiments and 3 donors. Error bars denote mean ± SD and significance was assessed by Student’s t-test, n=2 replicates per sgRNA. (B) Schematic of CRISPR mini-pool screen in primary human CD8+ T cells transduced with the NY-ESO-1-specific TCR, 1G4. (C) Results of the human CRISPR mini-pool screen aggregated by gene. (D) Results of the human CRISPR mini-pool screen with individual sgRNA replicates shown as dots. Genes are ordered from highest to lowest average LFC. Box plots show 25th, 50th (median), and 75th percentiles. Results shown in (C-D) are combined from 2 independent donors, 2 mice per donor, and 2 sgRNAs per target gene (n=8 sgRNA replicates per target). In (C-D), orange indicates inhibitory receptors, red indicates TCR signaling pathway genes, blue indicates chromatin remodelers and grey indicates negative controls. See also Table S5.

