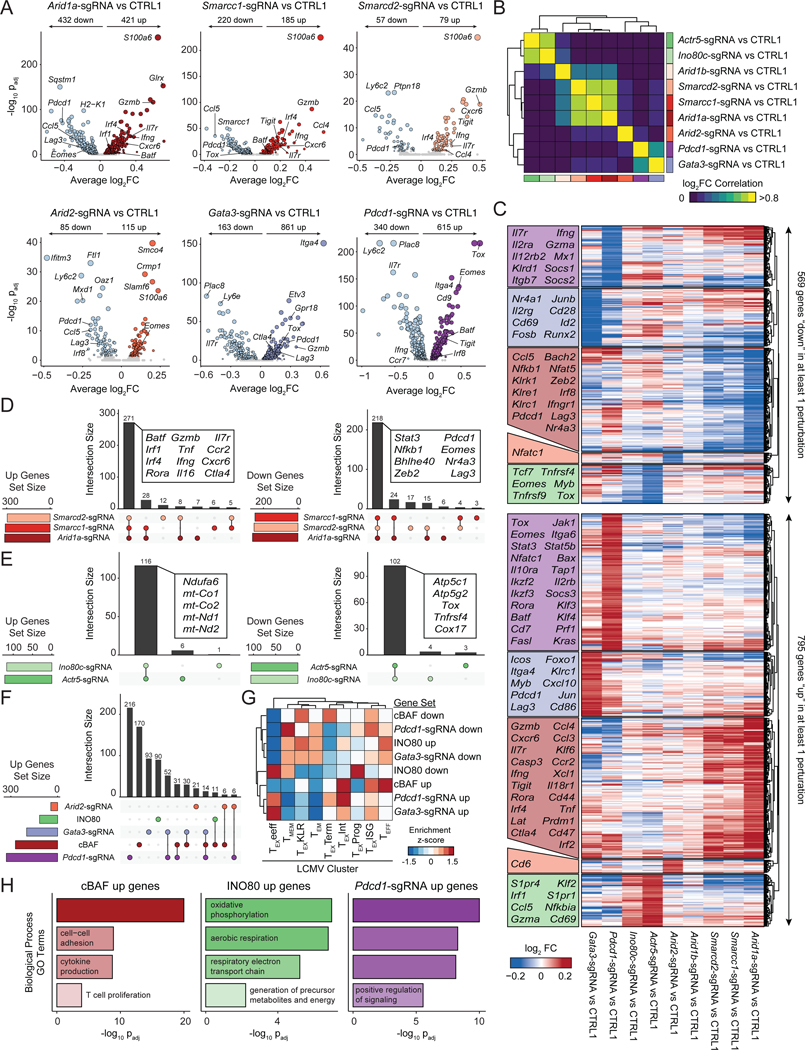
Figure 7: cBAF-depleted T cells exhibit enhanced effector gene signatures and reduced terminal exhaustion.
(A) Volcano plots comparing aggregated cells with the indicated perturbation versus CTRL1 cells. FDR values were calculated via Wilcoxon Rank Sum test, as implemented in Seurat. Sample size: n=4,668 (Arid1a-sgRNA), n=5,891 (Smarcc1-sgRNA), n=1,448 (Smarcd2-sgRNA), n=3,712 (Arid2-sgRNA), n=2,625 (Gata3-sgRNA), n=6,465 (Pdcd1-sgRNA), n=18,569 (CTRL1). (B) Pairwise correlations of gene expression differences induced by each perturbation. (C) Heatmap of all upregulated (up) or downregulated (down) genes in at least one perturbation, grouped by which perturbation has the strongest effect on expression. Selected genes in each block are labeled. (D) Comparison of upregulated or downregulated gene sets by perturbation of cBAF subunits, Arid1a, Smarcd2, or Smarcc1. (E) Comparison of gene sets up- or downregulated by perturbation of INO80 subunits Actr5, or Ino80c. (F) Comparison of gene sets upregulated by perturbation of cBAF subunits, INO80 subunits, or Pdcd1, Gata3, or Arid2. (G) Enrichments of upregulated and downregulated gene sets in LCMV expression data (Daniel et al., 2021). Module scores of each gene set were computed for each single cell in the LCMV dataset, averaged by cluster, and then z-scored to obtain the indicated enrichment z-scores. (H) Selected GO Terms of indicated gene sets. See also Figure S8 and Table S7.

