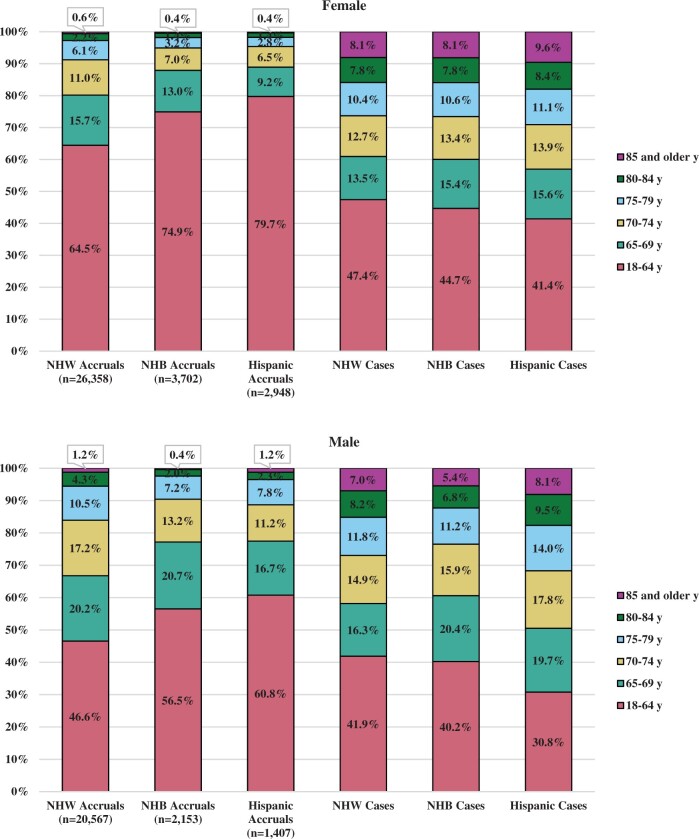
Figure 2.
Proportion of adult enrollments to the National Cancer Institute’s National Clinical Trials Network and estimated cancer incidence by age group, sex, race and ethnicity. All groups are mutually exclusive, limited to categories with at least 1000 enrollments in each subgroup. NHB = non-Hispanic Black; NHW = non-Hispanic White.

