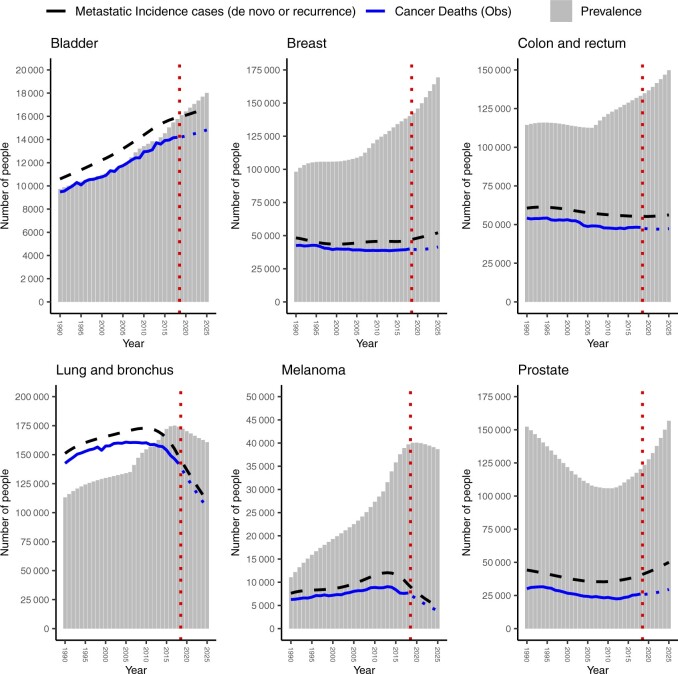
Figure 4.
Estimates and projections of metastatic cancer incidence and prevalence for both sexes combined in the United States from 1990 to 2025 (gray bars) by cancer type. Dashed black line is estimated number of new incidence cases with metastatic cancer, including de novo and recurrent metastatic cancer. Solid blue line is observed number of cancer deaths (all stages) from 1990 to 2018. Dotted blue line is projected number of cancer deaths (all stages) from 2019 to 2025. Dotted red line indicates projections from 2019 to 2025.

