
Fig. 1.
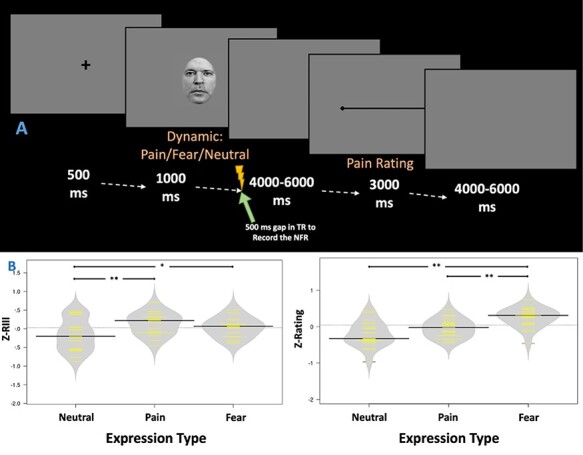
(A) Trials started with a 500 ms fixation point, followed by a 1-s clip displaying a pain, fear or neutral expression and ending with the application of a high-intensity shock in 33% of the trials. The timing of each trial was synchronized with the fMRI acquisition to allow for the measurement of the NFR during a 500 ms gap introduced between volumes (see details in fMRI image acquisition and analyses). The electrical stimulus was followed by a 4000–6000 ms delay before subjects rated the pain produced by the electrical stimulation. The total duration of a trial was 15 000 ms. (B) Graphs show the magnitude of individually Z-standardized NFR (left panel), and pain ratings (right panel) elicited by the high-intensity shock administered after clips displaying neutral, pain or fear expressions. Each yellow line represents an individual subject, and the black bars represent the group means. **P < 0.001, *P < 0.01.