
Fig. 2.
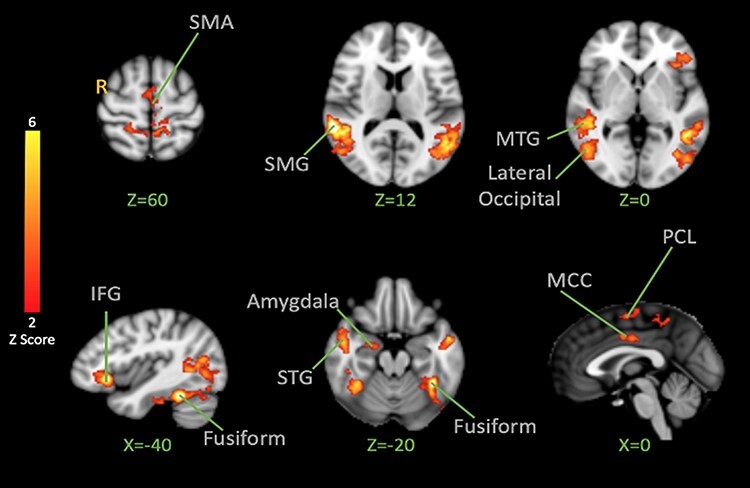
BOLD activation to pain and fear > neutral Facial Expression Observation. The color bar indicates Z-Score. The cluster-based threshold was corrected for multiple comparisons using GRF (P < 0.05). Peak coordinates are reported in Table 1.
Official websites use .gov
A
.gov website belongs to an official
government organization in the United States.
Secure .gov websites use HTTPS
A lock (
) or https:// means you've safely
connected to the .gov website. Share sensitive
information only on official, secure websites.
BOLD activation to pain and fear > neutral Facial Expression Observation. The color bar indicates Z-Score. The cluster-based threshold was corrected for multiple comparisons using GRF (P < 0.05). Peak coordinates are reported in Table 1.