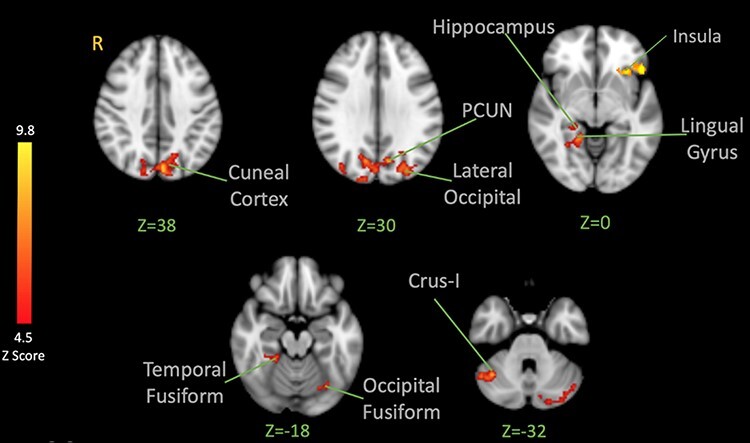
Fig. 6.

BOLD activation in the brain in response to noxious shocks after observation of pain facial expressions > after observation of fear facial expressions. The color bar indicates Z-Score. The activation map was cluster-corrected for multiple comparisons using GRF (P < 0.05). Peak coordinates are reported in Table 4.
