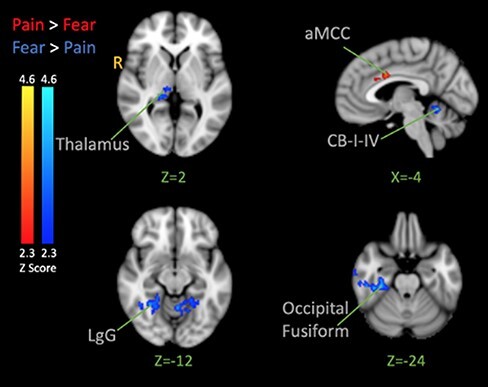
Fig. 7.

PPI analysis. The seed was the left INS. Contrasts show activation correlated with the activation of the insula moderated by the type of facial expressions that preceded the shock (Pain > Fear is red and Fear > Pain is Blue). The color bar indicates Z-Score. The activation map was cluster-corrected for multiple comparisons using GRF (P < 0.05). Peak coordinates are reported in Table 5.
