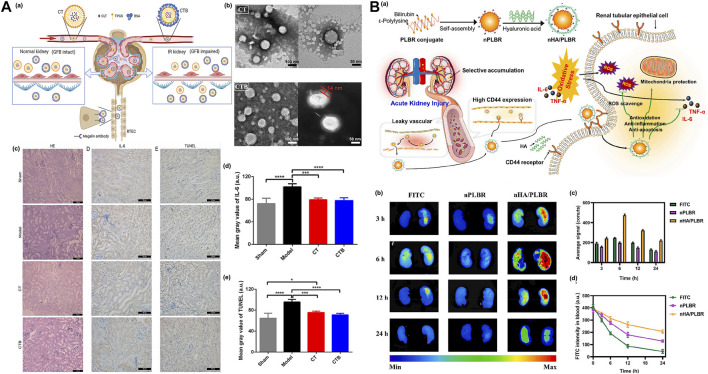
FIGURE 8.
(A) (a) Schematic diagram of the action of CLT-TPGS nanocomposite (CT) in IR-AKI mice. GFB, glomerular filtration barrier; RTEC, renal tubular epithelial cells, (b) Transmission electron microscope (TEM) images of CT or CTB, (c) The results of H-E staining, representative images of IL-6 expression, and TUNEL method were used to detect the apoptosis of renal cells in different groups, (d) Semi-quantitative results of IL-6 expression, (e) Semi-quantitative results of renal cell apoptosis. Adapted with permission from (J. Control. Release 2022, 349, 401–412.) (Qin et al., 2022); (B) (a) nHA/PLBR can accumulate in damaged renal tubular epithelial cells by targeting CD44, (b) Renal fluorescence intensity of AKI rat models treated with three different drugs, (c) Fluorescence intensity analysis, (d) Comparison of FITC fluorescence intensity in blood of mice in each group after administration. Adapted with permission from (J. Control. Release 2021, 334, 275–289.) (Huang Z.-W. et al., 2021).

