
Figure 3. Resting state functional connectivity analyses with the right lateral orbitofrontal cortex (OFC) as seed.
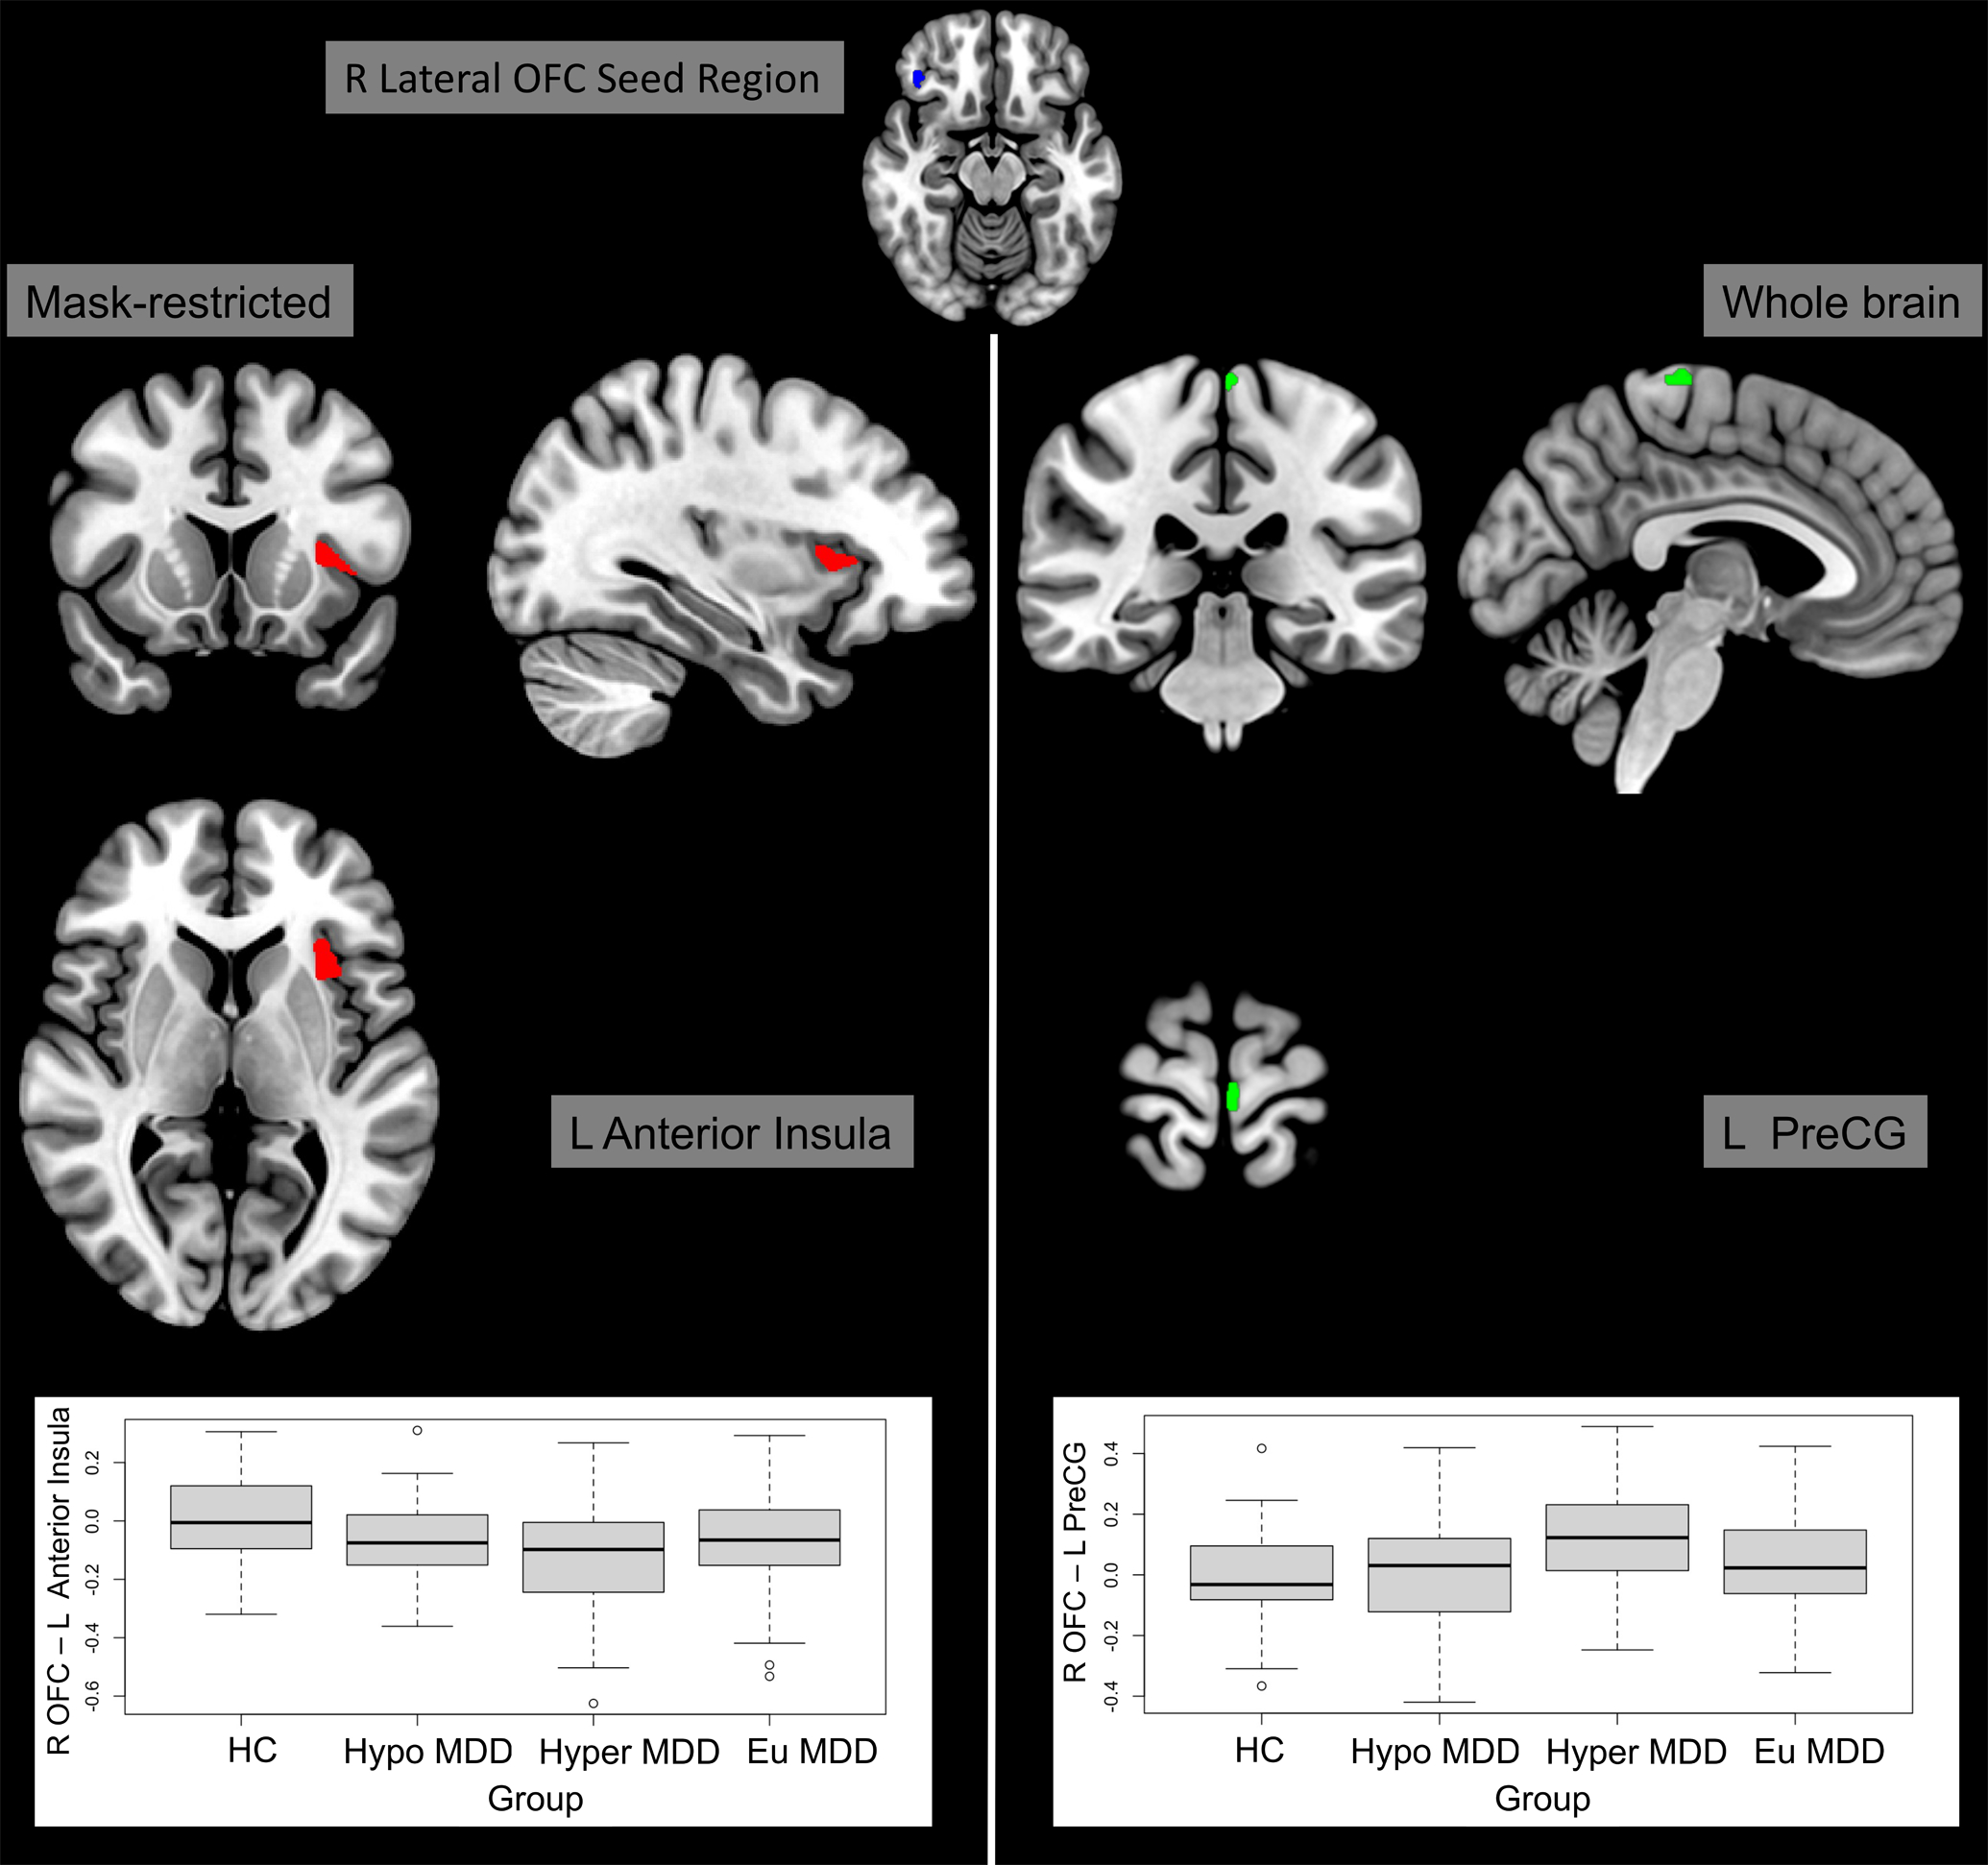
Compared to the healthy comparison group, the hyperphagic major depressive disorder group showed decreased resting-state functional connectivity to the left anterior insula and increased connectivity to the left precentral gyrus. Brain slices are presented in accordance with radiological convention (i.e., right hemisphere presented in left side of the image). Models included adjustment for sex and site.
(Abbreviations: Eu = euphagic; HC = healthy comparisons; Hyper = hyperphagic; Hypo = hypophagic; L = left; MDD = major depressive disorder; OFC = orbitofrontal cortex; PreCG = precentral gyrus; R = right)