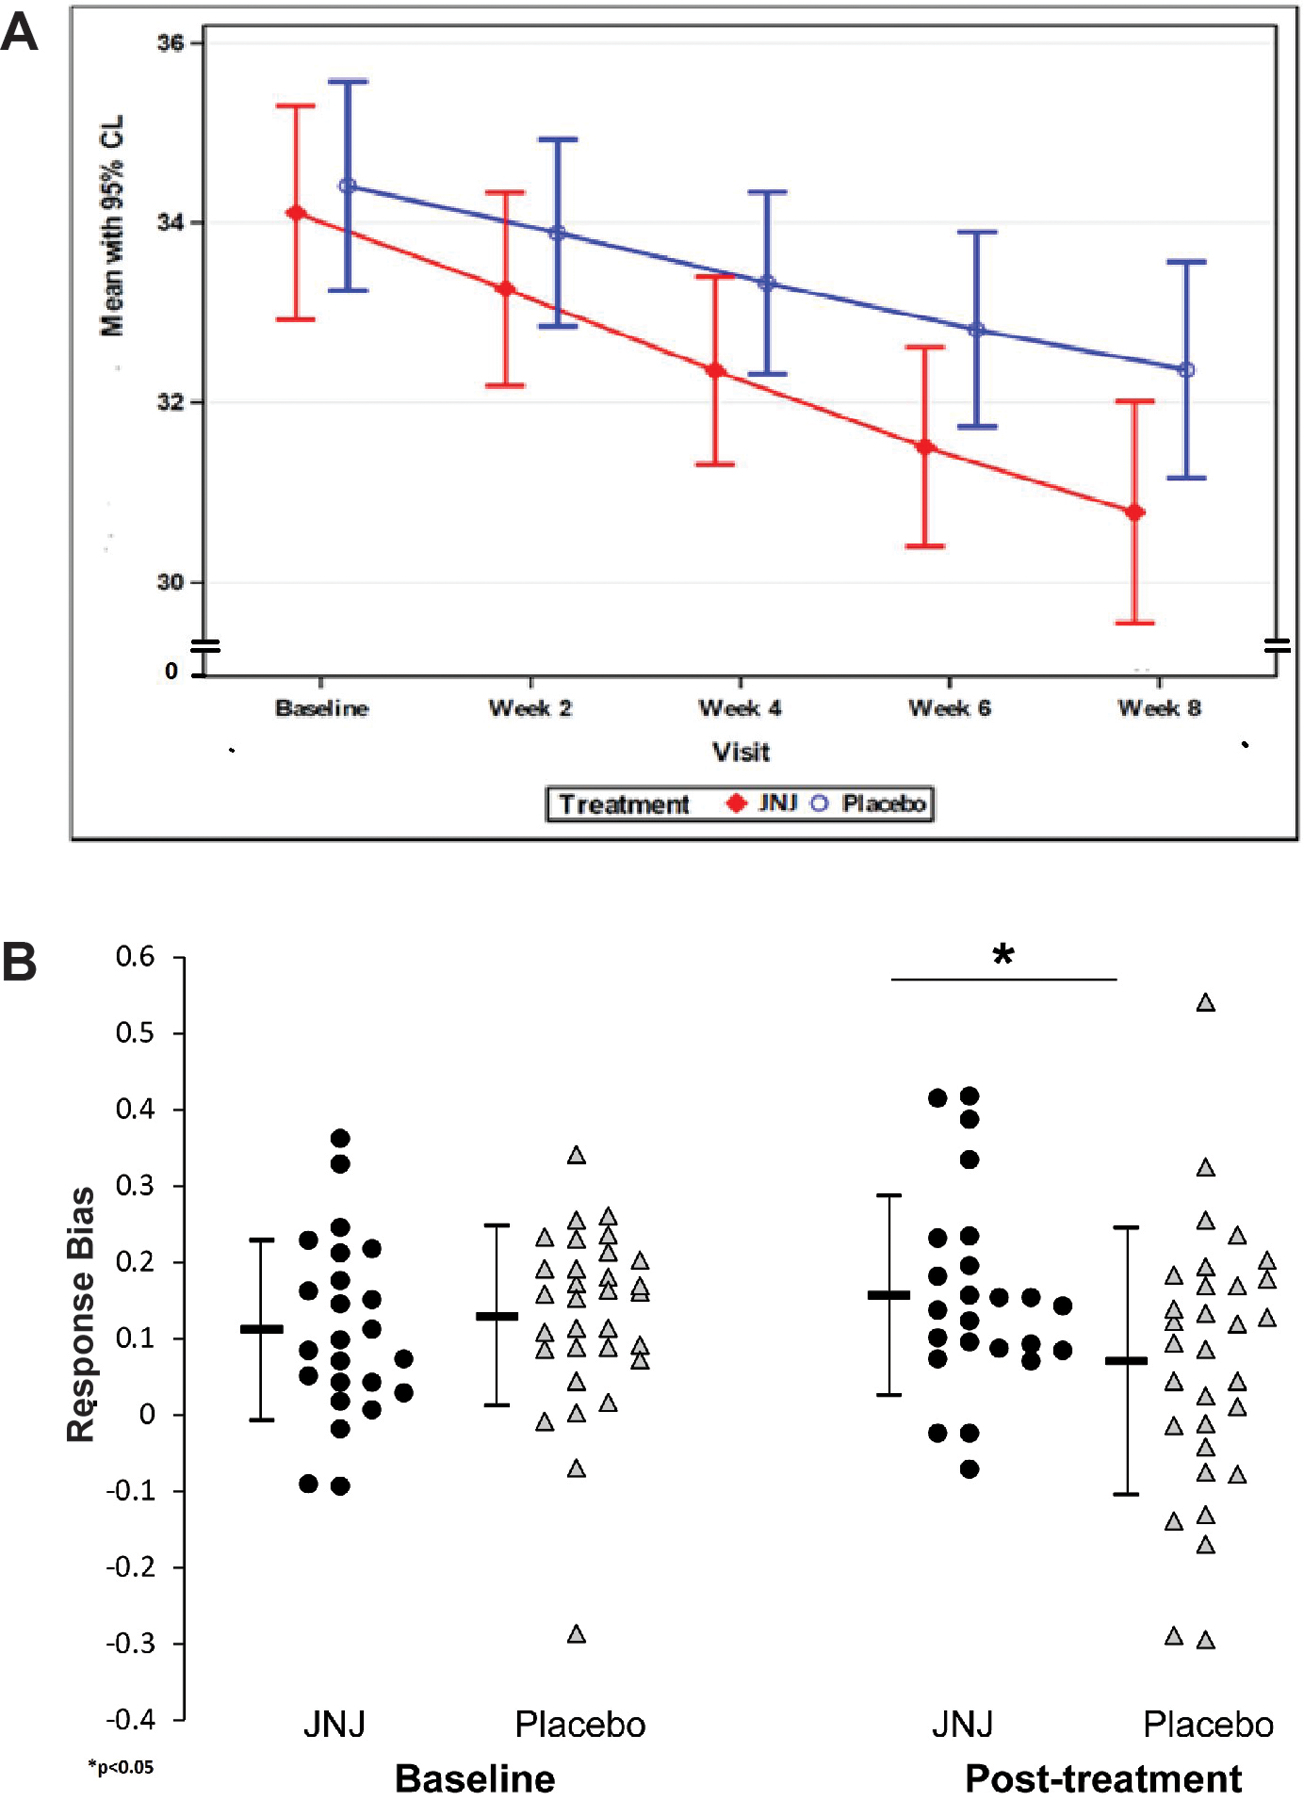
Figure 3:

a. Effects of study drug vs placebo on mean SHAPS score (intent-to-treat population). b. Effects of study drug vs placebo on mean PRT response bias (intent-to-treat population). Error bars represent 95% confidence intervals surrounding the means.
