Figure 1. Antibody affinity landscape.
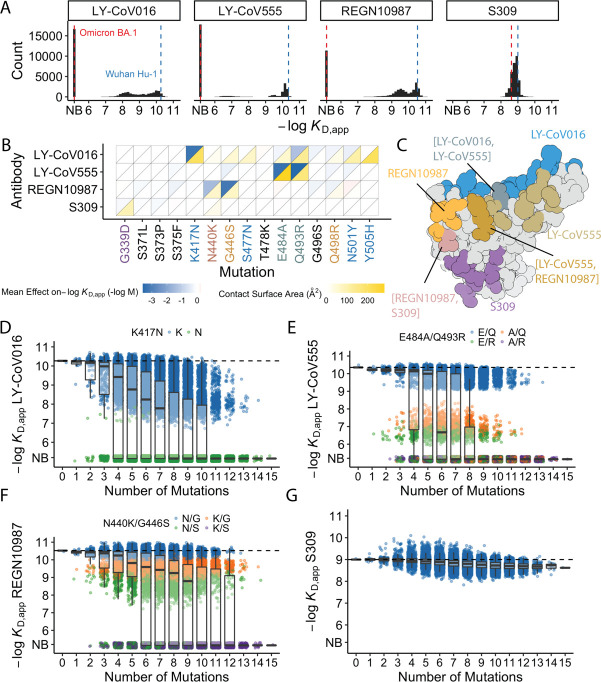
(A) Binding affinities to one antibody from each class (LY-CoV016, LY-CoV555, REGN10987, and S309, from classes 1–4, respectively) across all N=32,768 receptor binding domain (RBD) genotypes tested. Binding affinities are shown as −logKD,app; vertical blue and red dashed lines indicate the −logKD,app for Wuhan Hu-1 and Omicron BA.1, respectively. ‘NB’ denotes non-binding (escape). (B) Mean effect of each mutation on antibody and ACE2 affinity (defined as the change in −logKD,app resulting from mutation averaged across all backgrounds at the other loci) plotted with contact surface area between each residue and each antibody. Mutations are colored by footprint highlighted in (C). (C) Structure of SARS-CoV-2 BA.1 RBD with each antibody footprint annotated (PDB ID 7 KMG, 6WPT, 7C01, and 6XDG). Residues with overlapping footprints are colored and labeled accordingly. (D–G) Distribution of binding affinities to different antibodies grouped by number of Omicron BA.1 mutations. Binding affinity of the Wuhan Hu-1 variant is indicated by horizontal dashed lines. Variants with antibody escape mutations of interest are colored as noted in each key. NB denotes non-binding (escape). In all figures, the boxplots boxes show the spread between the 25th and 75th percentiles, with the median indicated by a horizontal line.
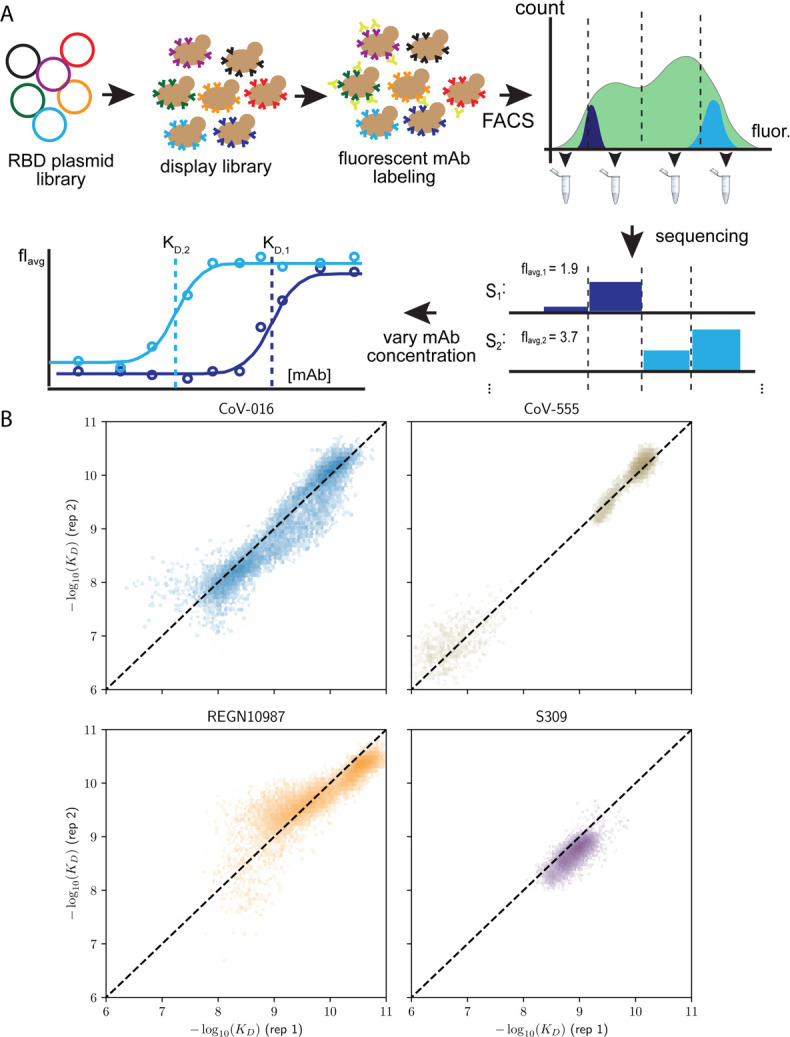
Figure 1—figure supplement 1. Schematic overview of the Tite-seq method and reproducibility of dissociation constants.

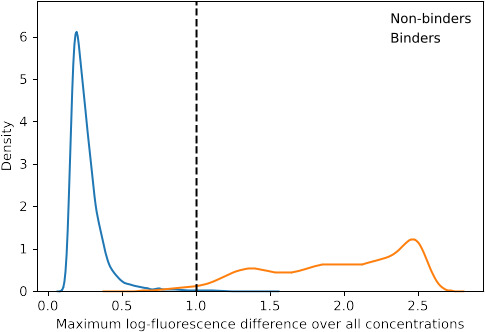
Figure 1—figure supplement 2. Distribution of maximum log-fluorescence difference.


