
Figure 2. Escape mutations and genotypes.
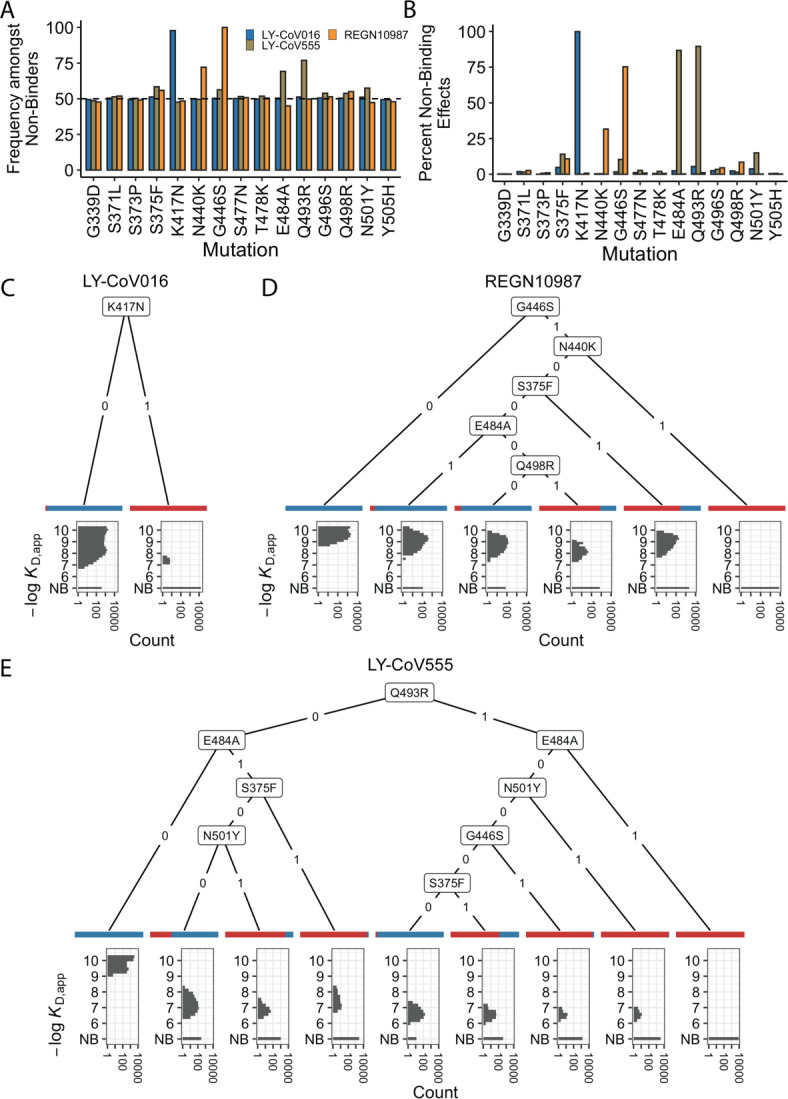
(A) Fraction of antibody-escaping genotypes with each mutation. (B) Fraction of variants for which a given mutation confers antibody escape. Effects are colored as in (A). (C–E) Decision trees of escape phenotype for each antibody modeled as a function of the mutations present. Each leaf is annotated by the proportion of the genotypes that escape the corresponding antibody (red: escape and blue: does not) and by corresponding affinity distribution. NB denotes non-binding.