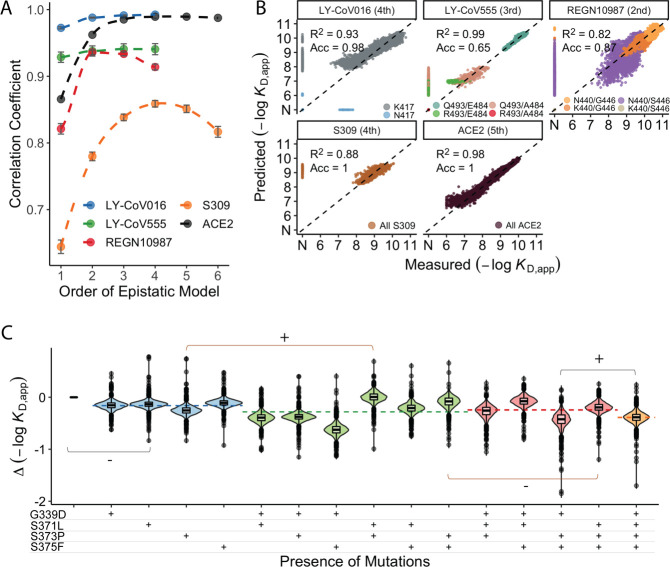
Figure 3. Epistastic effects on antibody binding.
(A) Correlation coefficients between the measured values of −log(KD,app) and the model estimate for various orders of epistatic models. Correlations are computed on the hold-out subset averaged over 10-folds of cross-validation. Zoomed-in version for orders 3–6 (sample size n=10) (B) Binding affinities predicted by complete coefficients from the optimum epistasis model are compared to the measured binding affinities for each antibody. Points are colored by mutations present in the genotypes, ‘N’ corresponds to non-binding genotypes. The accuracy measures the quality of the binary classification between binders and non-binders, and the coefficient of determination R² refers to the correlation between inferred and measured binding affinities, excluding non-binders. (C) Effects of mutations G339D, S371L, S373P, and S375F on S309 affinity grouped by the presence of each mutation. Each violin color corresponds to the number of mutations considered. Dashed line color denotes the average effect for each group represented by the violin color. The gray and orange lines indicate cases where the addition of mutation S371L has a positive (+) or negative (−) effect depending on the background (sample size n=2048).


