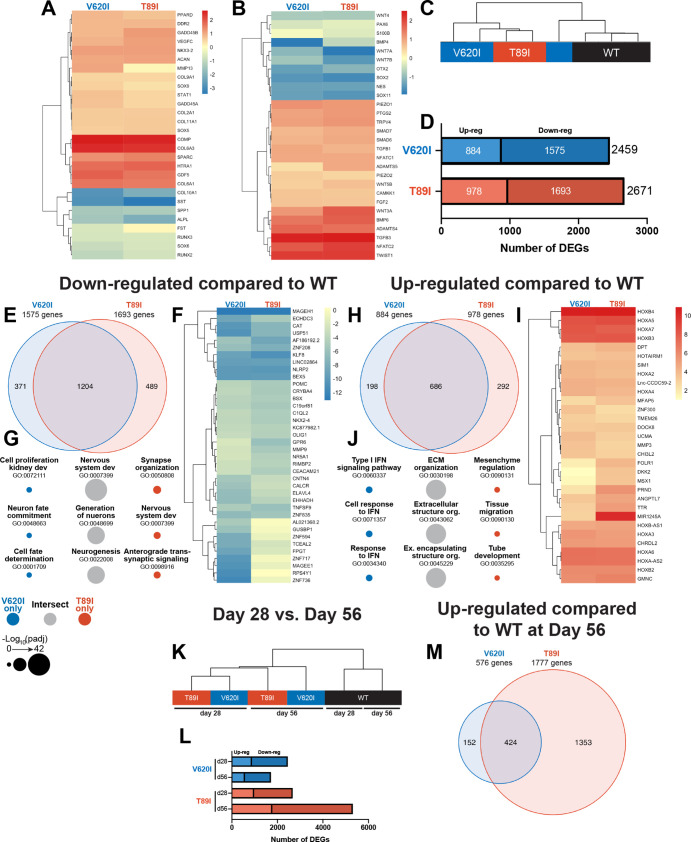
Figure 4. Dynamic changes in transcriptomic profiles of V620I and T89I mutants during chondrogenesis.
Heatmaps comparing the log2 fold change of common chondrogenic and hypertrophic genes (A) and growth factor and signaling genes (B) in day-28 V620I and T89I chondrocytes compared to wildtype (WT). (C) Clustering of the samples using Euclidean distances reveals that V620I and T89I human-induced pluripotent stem cell (hiPSC)-derived chondrocytes are more similar to each other than WT. (D) The number of up- and down-regulated differentially expressed genes (DEGs) in V620I and T89I day-28 chondrocytes compared to WT. (E–G) Analysis of the down-regulated genes compared to WT. (E) A Venn diagram reveals the number of similar and different down-regulated DEGs between V620I and T89I, where most genes are shared. (F) A heatmap showing the log2 fold change, compared to WT, of the top 25 down-regulated genes for each line. (G) The top 3 Gene Ontology (GO) terms (biological process) associated with the DEGs unique to V620I, shared between V620I and T89I, and unique to T89I. Symbol color represents the cell line, and size represents the −log10(padj).(H–J) Analysis of the up-regulated genes compared to WT. (H) A Venn diagram reveals the number of similar and different up-regulated DEGs between V620I and T89I, where most genes are shared. (I) A heatmap showing the log2 fold change, compared to WT, of the top 25 up-regulated genes for each line. (J) The top 3 GO terms (biological process) associated with the DEGs unique to V620I, shared between V620I and T89I, and unique to T89I. Symbol color represents the cell line, and size represents the −log10(padj). (K) Clustering of the day-28 and -56 samples using Euclidean distances reveals that the WT chondrocytes, at both days 28 and 56, cluster together while mutants cluster by time point. (L) The number of up- and down-regulated DEGs for V620I and T89I compared to WT at days 28 and 56. (M) A Venn diagram reveals the number of similar and different up-regulated DEGs between V620I and T89I, with T89I becoming more unique at day 56. n = 3–4 samples.


