. 2023 Feb 22;12:e71154. doi: 10.7554/eLife.71154

Figure 5. Wildtype (WT) chondrocytes are more sensitive to BMP4 treatment.

(A) WT chondrocytes treated with BMP4 developed a hypertrophic phenotype with enlarged lacunae, which was not present in the mutant cell lines or other conditions, as shown by Safranin-O and hematoxylin staining. Scale bar = 500 µm. Representative images from 2 experiments. (B) Cell diameter was significantly increased in the WT with BMP4 treatment compared to all other groups indicating a hypertrophic phenotype. Mean ± standard error of the mean (SEM). n = 249–304 cells from 2 pellets. Different letters indicate statistical significance (p < 0.05) between groups as determined by Kruskal–Wallis test with multiple comparisons since data was not normally distributed. (C) Western blot shows that WT had a stronger increased production of ALPL, COL10A1, IHH, RUNX2, and RUNX2-9 in response to BMP4 treatment than the mutants. (D) Principle component analysis (PCA) of bulk RNA-seq reveals an increased sensitivity to BMP4 (and TGFβ3 + BMP4) treatment in WT human-induced pluripotent stem cell (hiPSC)-derived chondrocytes compared to V620I and T89I. n = 3–4 samples.

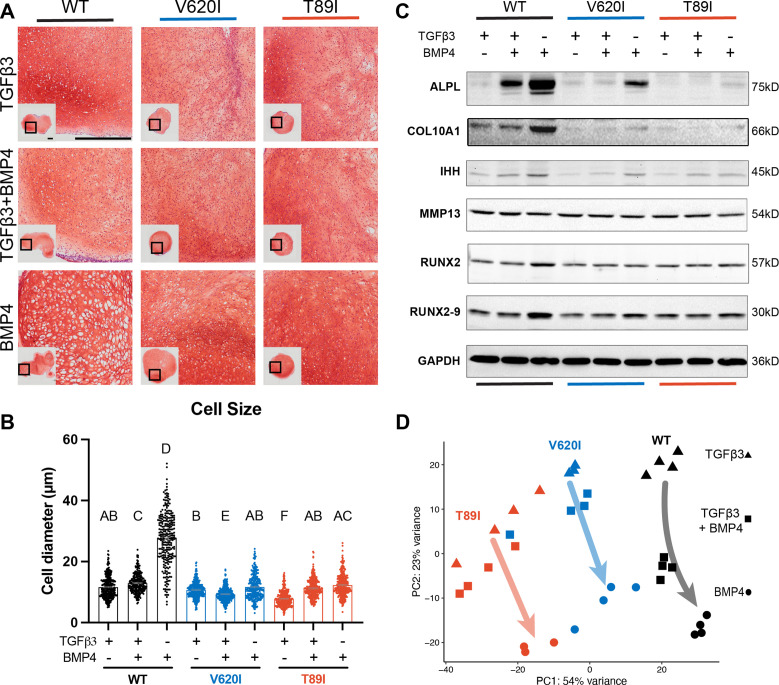
Figure 5—source data 1. ALPL western blot: the full raw unedited gel with and without the bands labeled.
Figure 5—source data 2. COL10A1 western blot: the full raw unedited gel with and without the bands labeled.
Figure 5—source data 3. IHH western blot: the full raw unedited gel with and without the bands labeled.
Figure 5—source data 4. MMP13 western blot: the full raw unedited gel with and without the bands labeled.
Figure 5—source data 5. RUNX2 western blot: the full raw unedited gel with and without the bands labeled.
Figure 5—source data 6. GAPDH western blot: the full raw unedited gel with and without the bands labeled.

Figure 5.

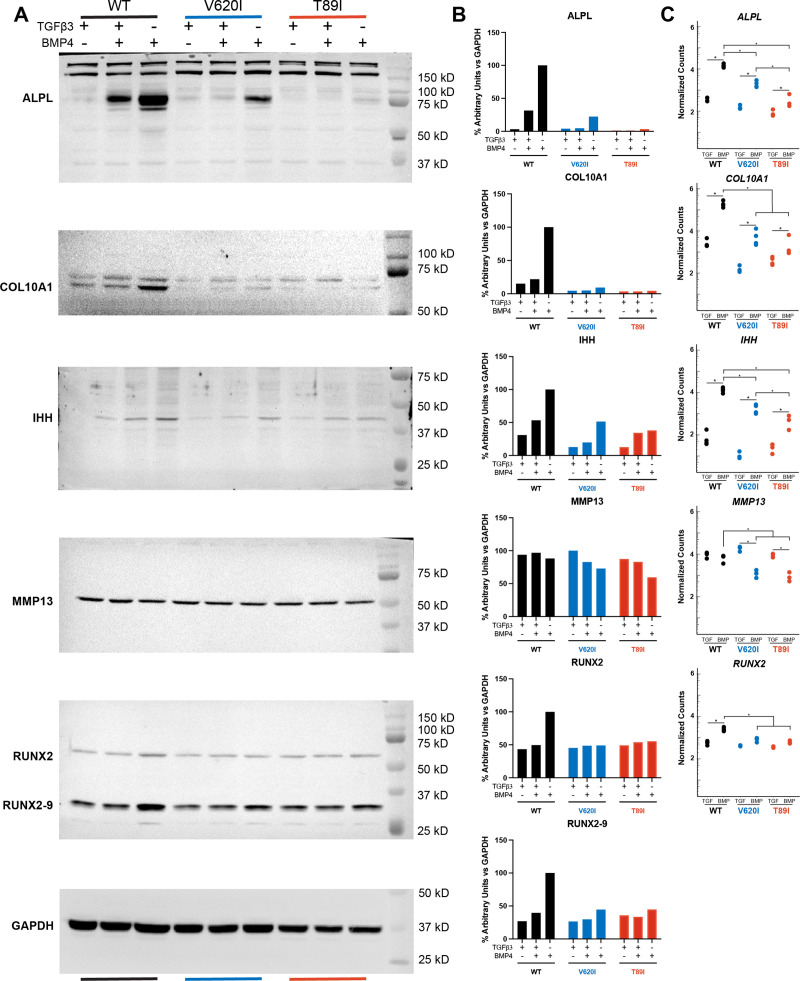
Figure 5—figure supplement 1. Hypertrophic gene and protein expression.

Figure 5—figure supplement 1.

(A) The full images of the ALPL, COL10A1, IHH, MMP13, RUNX2, RUNX2-9, and GAPDH western blots. (B) Quantification of the western blots. (C) Gene expression from RNA sequencing for the same genes. For simplicity, TGFβ3- and BMP4-treated groups were included in the graphs. Mean ± n = 3–4. *p < 0.05. Significance determined by Student’s t-test comparing TGFβ3- and BMP4-treated groups within the cell line and one-way analysis of variance (ANOVA) with Tukey’s post hoc test comparing cell lines within BMP4-treated group.