
FIGURE 2.
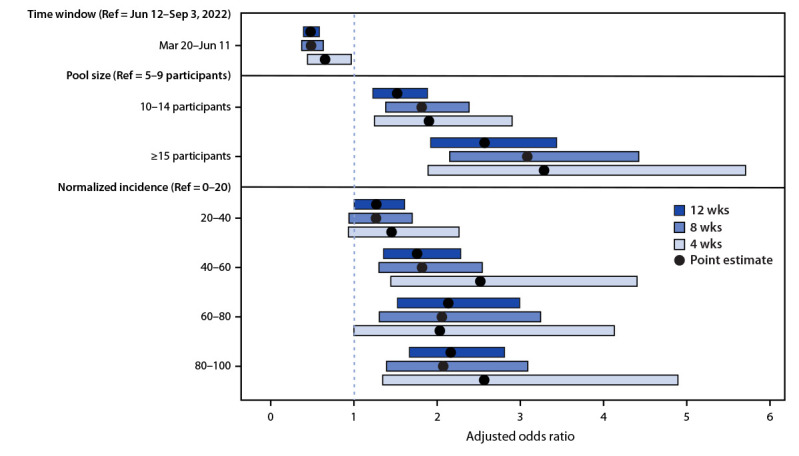
Comparison of mixed effects models*,† for pooled SARS-CoV-2 test results across different time windows before and after June 12, 2022 — Traveler-based Genomic Surveillance Program, United States, March 20–September 3, 2022
Abbreviation: Ref = referent group.
* Adjusted odds ratio point estimates relative to each Ref with 95% CIs.
† Incidence was normalized by dividing the 7-day average COVID-19 incidence (cases per 100,000 population) for the flight origin country on the date of collection by the maximum 7-day average daily incidence for that country during the analysis period and multiplying by 100.