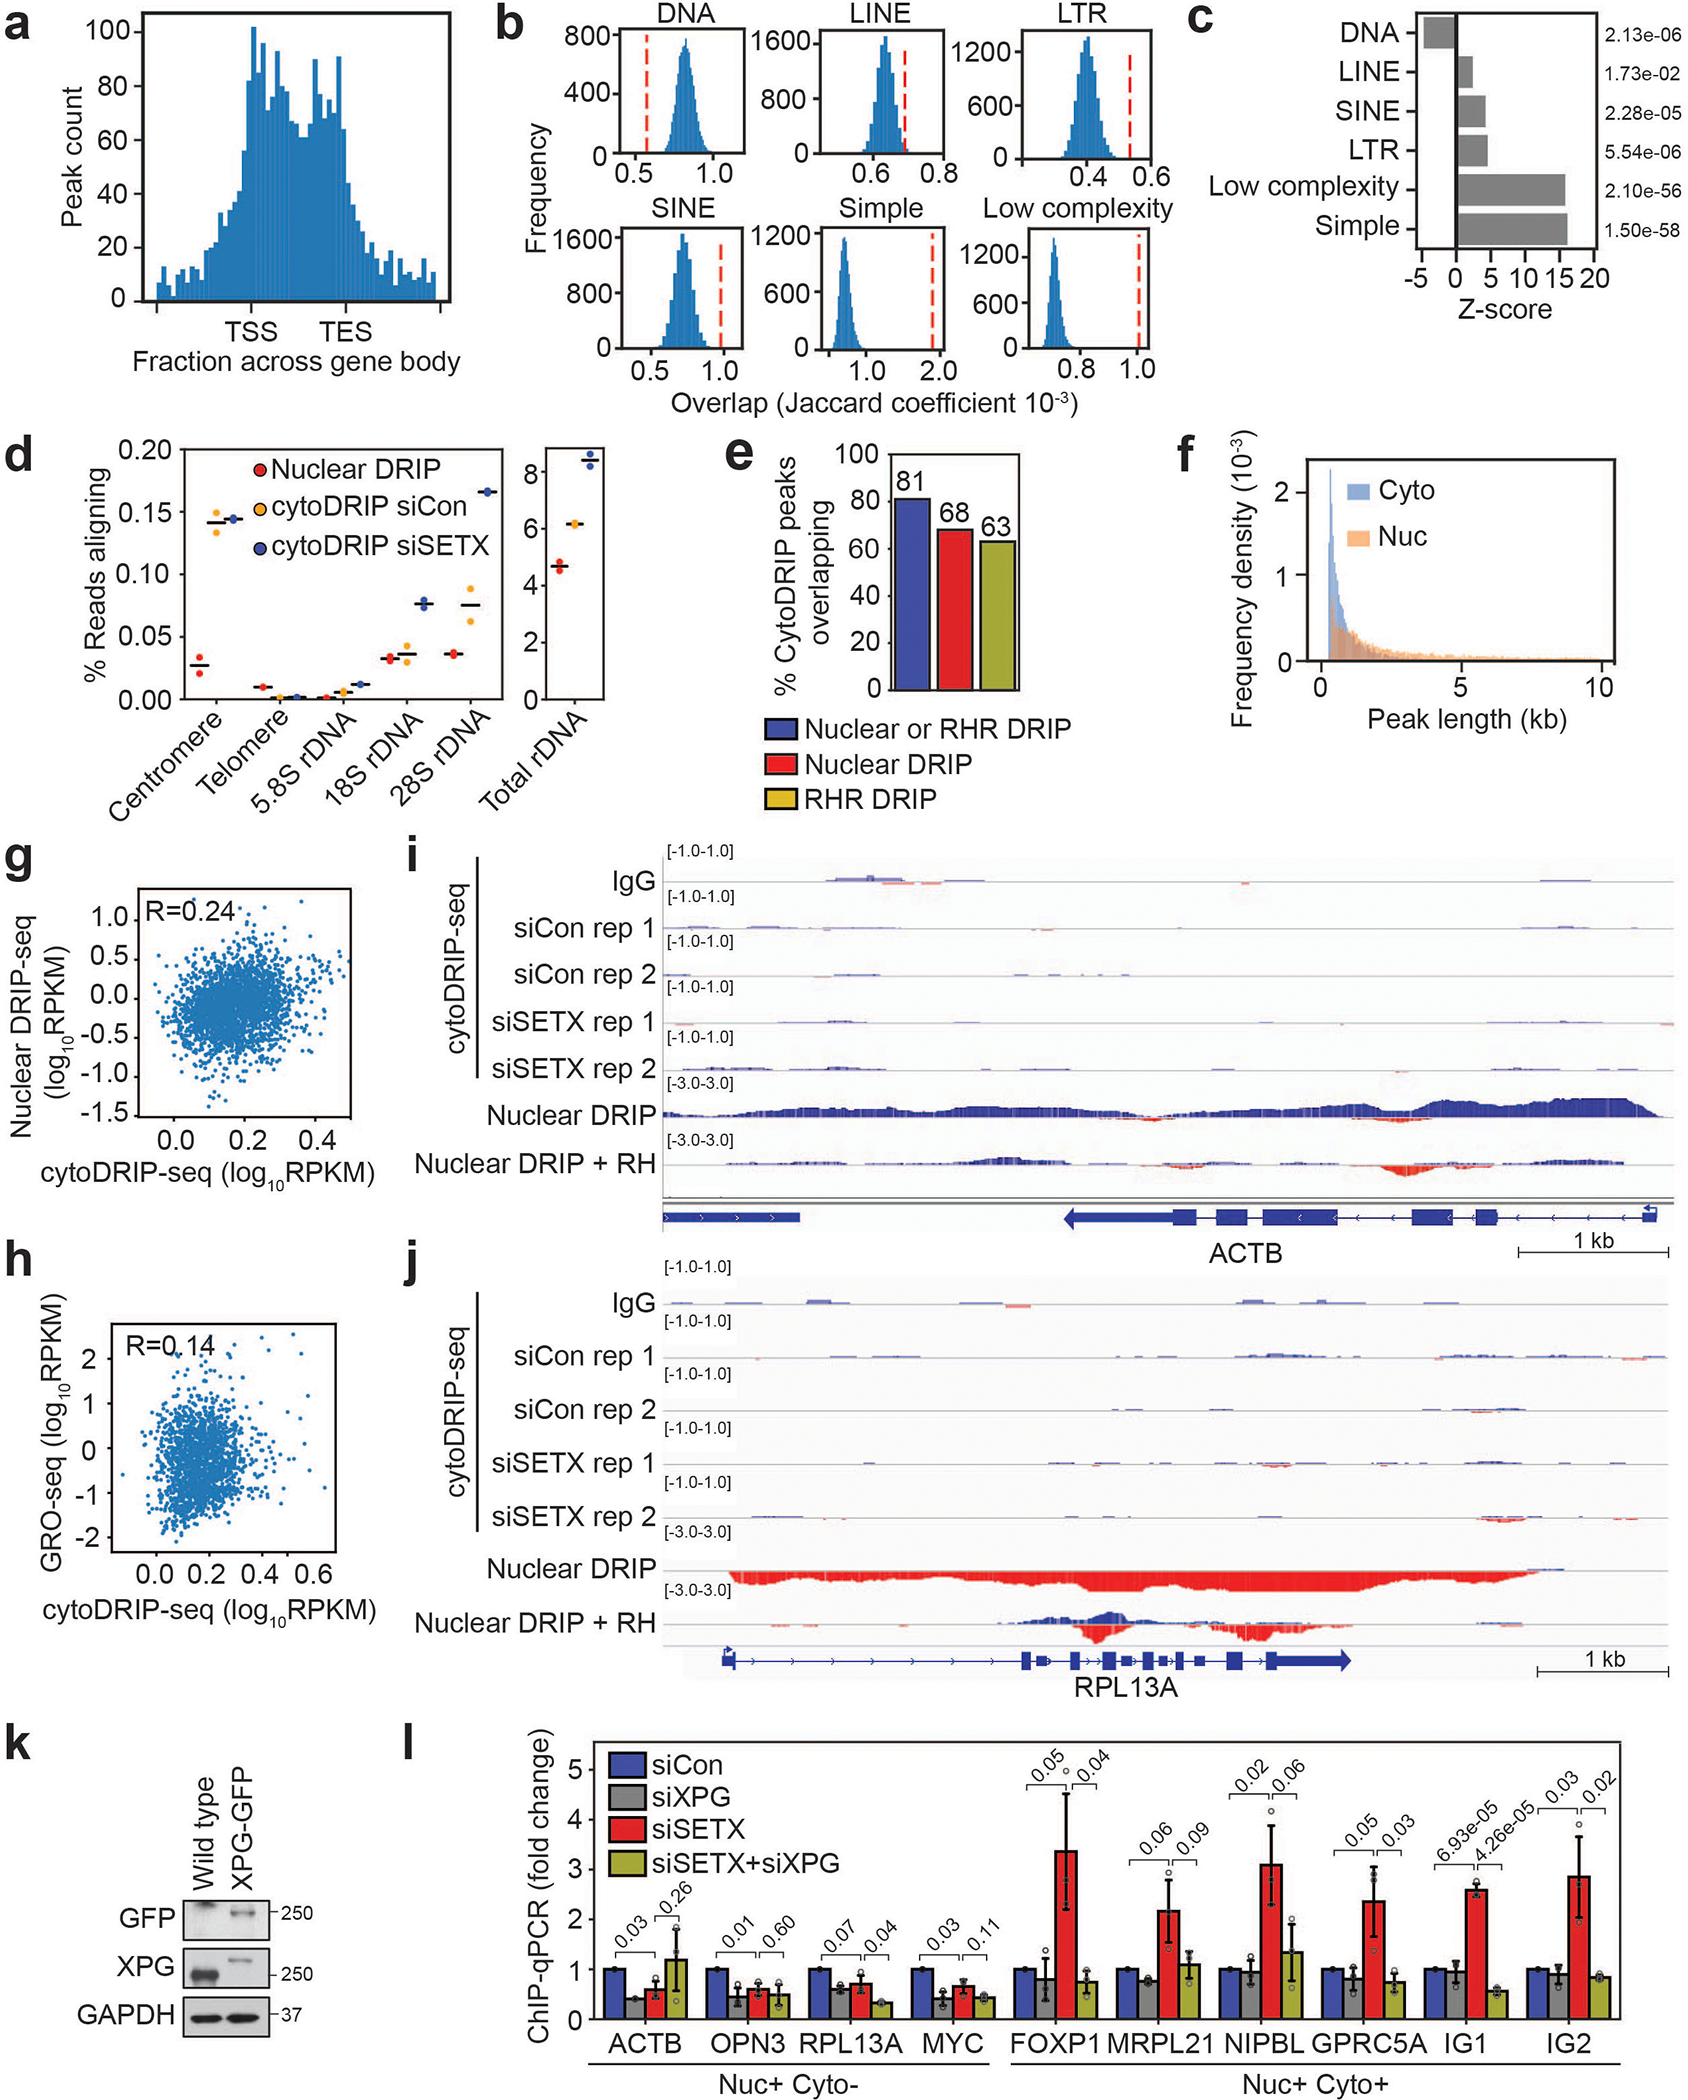
Extended Data Fig. 4. CytoDRIP sites map to genic and intergenic regions.

(a) Histogram showing distribution of cytoDRIP peaks over genes. Positions of transcription start site (TSS) and transcription end site (TES) are indicated.
(b) Blue histograms show expected overlaps between repeat elements and randomly sampled peak sets (matched in size and number from cytoDRIP peaks) from within all nuclear R-loop peaks. Red dashed line indicates the observed overlap for cytoDRIP peaks.
(c) Z-scores for the overlaps calculated in (b); individual p-values are shown on the right.
(d) Proportion of nuclear DRIP-seq and cytoDRIP-seq reads aligning to consensus regions for rDNA, alpha satellite for centromeres and telomeric repeats. Data are from two independent biological replicates (n = 2) per condition, black lines show the mean.
(e) Bar plot showing proportion of cytoDRIP peaks overlapping nuclear DRIP and/or RNase H resistant hybrid (RHR) sites.
(f) Histogram of peak lengths comparing cytoDRIP-seq (siSETX condition) (Cyto) and nuclear DRIP-seq (Nuc) peaks.
(g) Scatter plot correlating nuclear DRIP-seq signal at cytoDRIP regions with cytoDRIP-seq signal, Pearson’s correlation: R = 0.24.
(h) Scatter plot correlating nascent transcription by GRO-seq at cytoDRIP regions with cytoDRIP-seq signal, Pearson’s correlation: R = 0.14.
(i,j) Genome browser views showing lack of cytoDRIP signal at sites with robust nuclear R-loop formation (i) ACTB, (j) RPL13A. From top to bottom normalized tracks are: IgG, siCon (2 replicates), siSETX (2 replicates), nuclear DRIP-seq, nuclear DRIP-seq + RH. Red indicates negative strand signal, blue indicates positive strand signal.
(k) Western blot showing HeLa cells stably expressing GFP-tagged XPG. GAPDH is the loading control.
(l) GFP ChIP-qPCR in HeLa cells following knockdown of SETX and/or XPG, showing GFP-XPG binding at hybrid sites. ‘Nuc+ Cyto+’ sites were found in the nucleus and cytoplasm, while ‘Nuc+ Cyto−’ sites were only found in the nucleus. Gene names are shown; IG1 and IG2 are intergenic sites. Shown is the mean ± s.d. from three independent biological replicates (n = 3); unpaired two-tailed t-test; p-values are shown.
