
Figure 4: Upregulation of GLI genes and repressor proteins at TD0 in TS-derived BG organoids.
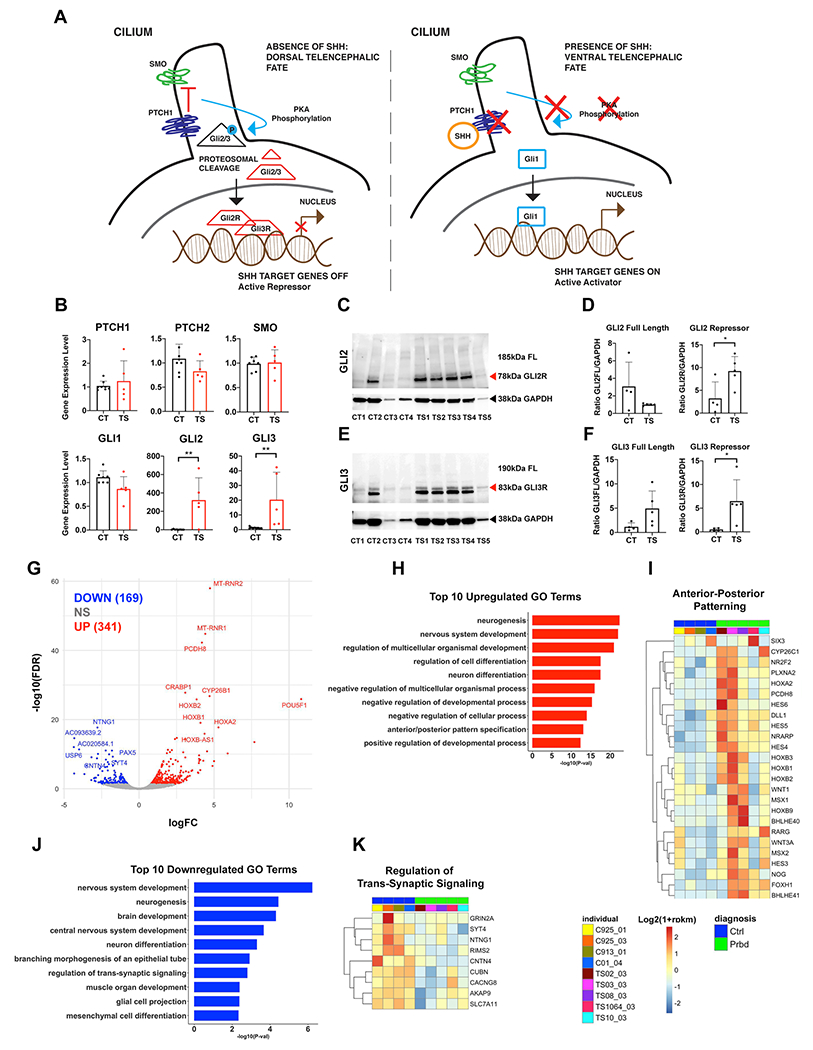
(a), Schematic diagram of SHH signaling in dorsal and ventral contexts. (b), qPCR examining expression levels of key SHH signaling players in BG organoids at TD0. (c-f), Western blots for GLI2 and GLI3 repressor proteins in CT- and TS-derived BG organoids. See Supplementary Figure 9 for additional western blots with full length (FL) GLI2 and GLI3 protein expression. Protein bands were quantified by ImageJ software (n=4 CT; n=5 TS iPSC lines). CT lines 1-4 are as follows: 7978-01 #1; RDH925-01 #10; RDH913-01 #1; 01-04 #28. TS lines 1-5 are as follows: TS 02-03 #4; TS 03-03 #12; TS 08-03 #7; TS 10-03 #22; TS 1064-03 #12. (g) Volcano plots of TS vs CT DGE at TD0. Topmost significant up and downregulated genes were labeled. n=5 CT; n=5 TS. (h), Top 10 GO terms enrichment for upregulated DGE (P<0.05) at TD0. (i), Heatmaps of expression levels for DEGs associated with Anterior-Posterior Patterning. (j), Top 10 GO terms enrichment for downregulated DGE (P<0.05) at TD0. (k), Heatmaps of expression levels for the DEGs associated with Regulation of Trans-Synaptic Signaling. For all TD0 RNA sequencing, n=5 TS; n=4 CT. All heatmaps show log2(1+rpkm) values that were scaled in each row.