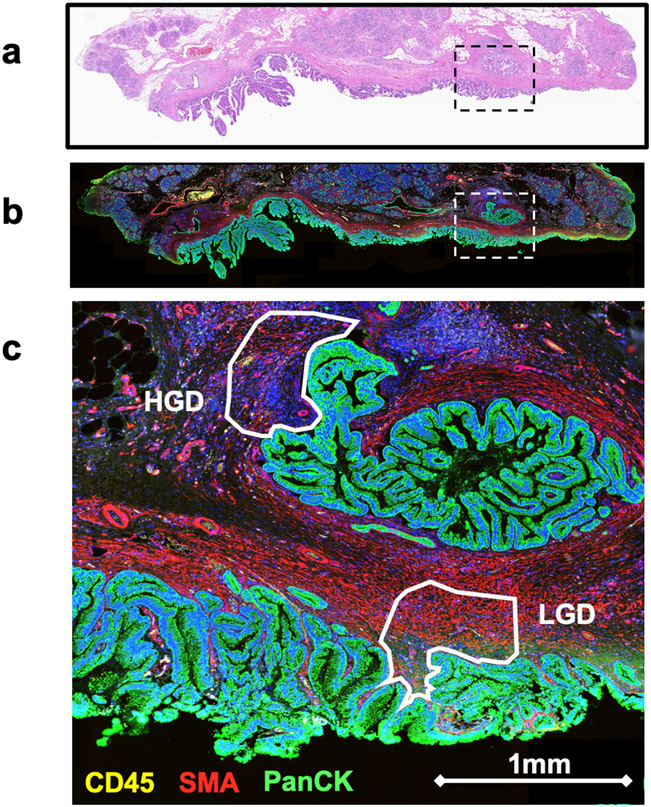
Figure 1:
Selection of ROIs within IPMN. A) A low power H&E of IPMN tissue containing regions of LGD and HGD. B) A low power spatial transcriptomics generated image with fluorescent staining DNA (blue), PanCK (green), CD45 (yellow), and SMA (red). The boxed region contains two ROIs seen in Figure 1c. C) A high power magnification of two stroma ROIs. ROIs are annotated according to the grade of dysplasia present within adjacent epithelium.

