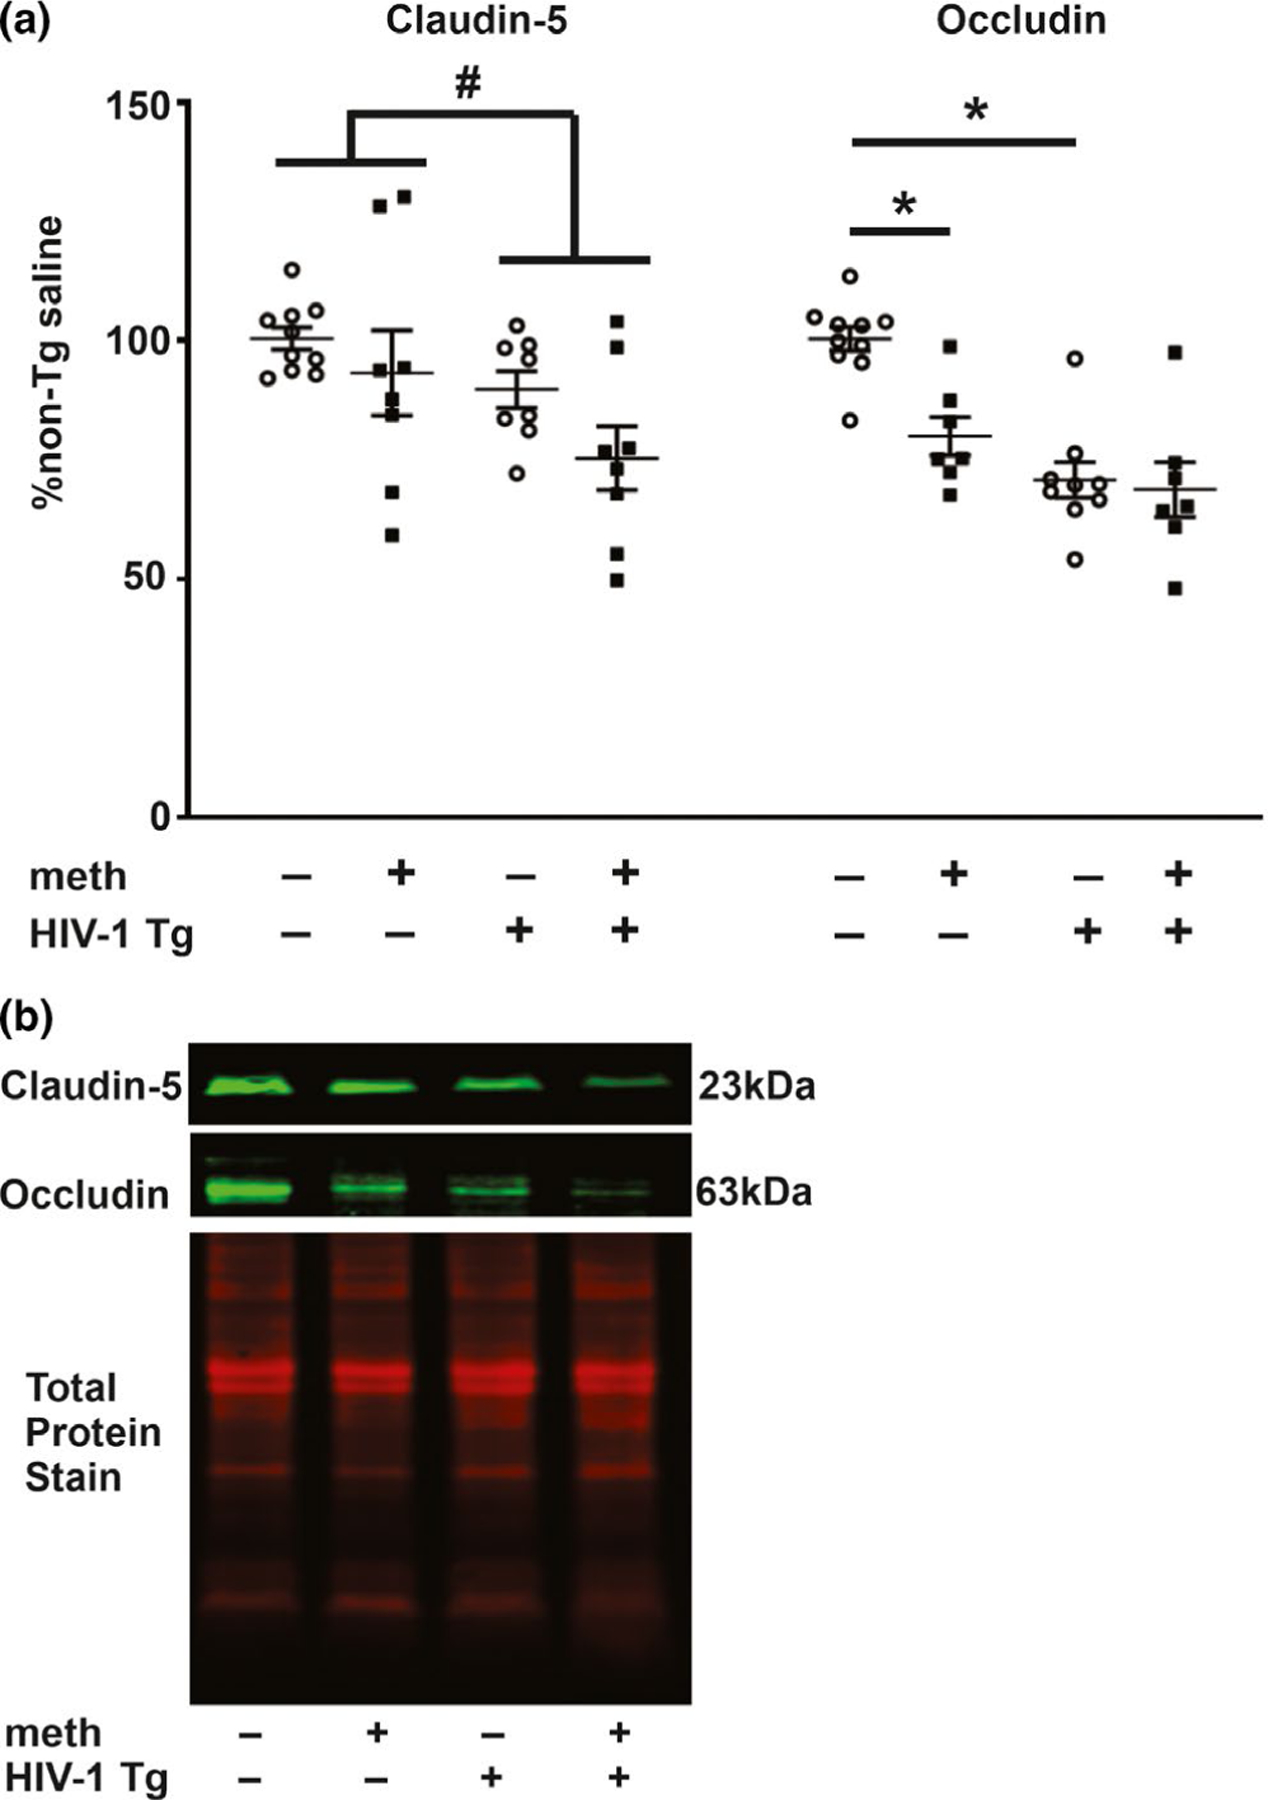
FIGURE 1.

Claudin-5 and occludin protein levels. (a) Claudin-5 levels were reduced in the hippocampus of HIV-1 Tg rats irrespective of treatment. Occludin levels were also reduced independently by the HIV-1 transgene and by meth. (b) Representative photomicrograph of claudin-5, occludin and total protein immunoblots. Data are expressed as mean + SEM. # indicates significant main effects by two-way ANOVA. * indicates planned contrasts that showed differences with a Newman–Keuls post hoc test (p < .05). Cldn-5, claudin-5; occldn, occludin. n = 8/group [Colour figure can be viewed at wileyonlinelibrary.com]
