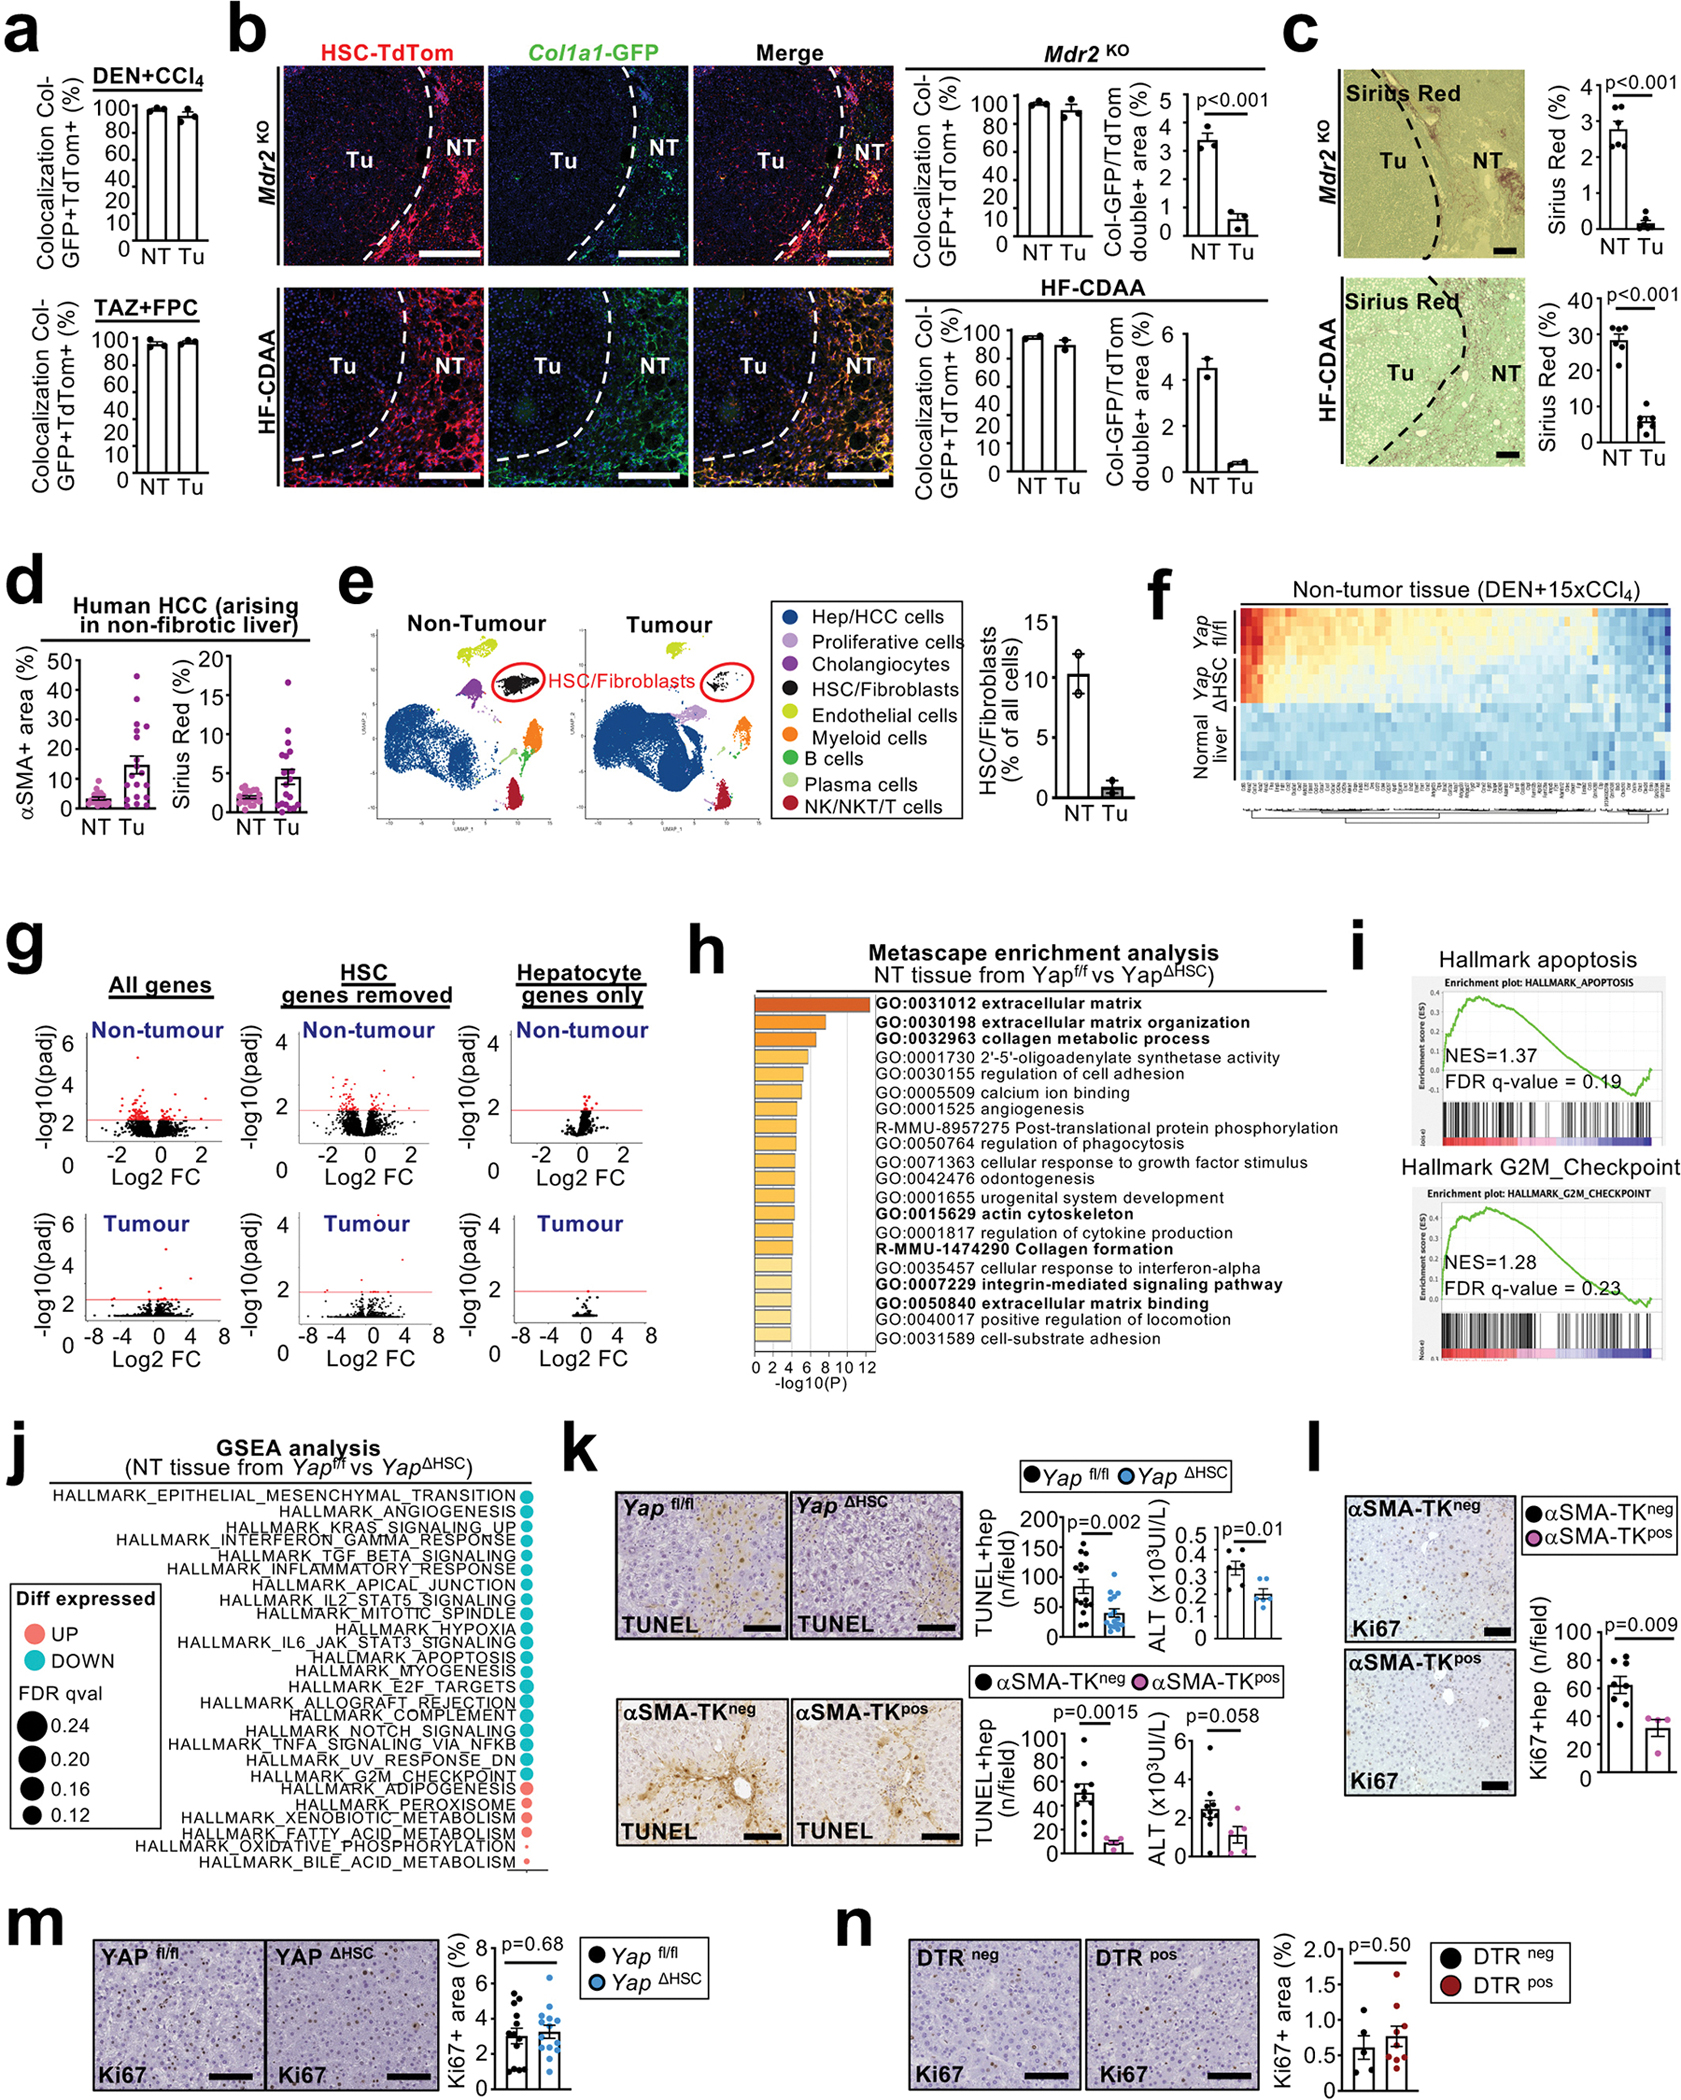
Extended Data Figure 3 |. Hepatic stellate cell accumulation occurs predominantly in the PME and affect genes and pathways relevant for tumourigenesis and fibrosis.

a, co-localization of Col1a1-GFP+ and LratCre-induced TdTom was quantified in non-tumour (NT) and tumour (Tu) areas of DEN+CCl4- and TAZ-FPC-induced HCC (n=3 mice/HCC model – data related to Figure 2a). b, LratCre-TdTom+ HSC and Col1a1-GFP+ fibroblasts were visualized, and co-localization of Col1a1-GFP+ and LratCre-induced TdTom and the Col1a1-GFP/TdTom double-positive area were quantified in 15 month-old Mdr2KO-induced (n=3 mice) and HF-CDAA-diet-induced (n=2 mice) HCC. c, Fibrosis was visualized and quantified by Sirius Red in 15 month-old Mdr2KO-induced and HF-CDAA-diet-induced HCC (n=6 mice/group/HCC model). d, αSMA and Sirius Red quantification of paired non-tumour and human HCC developing in non-fibrotic livers (n=20 cases - data related to Figure 2b). e. UMAP visualization of cell populations from snRNA-seq of matching human non-tumour cirrhotic liver (n=2) and tumour (n=2) liver tissue pairs as well as the proportion of HSC/fibroblasts in both compartments. f-j, Bulk RNAseq of liver tissue from DEN+CCl4-treated Yapf/f (n=5), YapΔHSC mice (n=5) and normal liver (n=8 mice). The heatmap displays up- and downregulated differentially expressed genes (DEG) in non-tumour tissue based on DESeq2 analysis from bulk RNAseq (compared to the normal liver, adjusted p-value <0.1 and log2FC>0.5 or < −0.5) (f). Comparison of genes expression in Yapfl/fl and YapΔHSC tumour and non-tumour areas in DEN+CCl4-induced HCC (n=5 mice/group) data are displayed as volcano plot before and after removal of HSC genes, identified by scRNA-seq analysis, or filtering on hepatocyte genes, identified by scRNA-seq analysis (n=5 mice/group) (g). Metascape enrichment analysis of down-regulated DEG genes in non-tumour tissues of YapΔHSC compared to Yapf/f, all the pathway related to fibrosis and HSC-activation are marked in bold (n=5 mice/group) (h). Gene set enrichment of RNA-seq data revealed apoptosis and G2/M checkpoint as enriched in Yapfl/fl vs YapΔHSC non-tumour tissue (i). Displayed is the gene set enrichment analysis of the collection “Hallmark gene set” from the MSigDB with a FDRqval <0.25 in non-tumour tissues of Yap ΔHSC compared to Yap f/f (n=5 mice/group) (j). k-l, hepatocyte death (k) and proliferation (l) were determined by TUNEL assay: YAP f/f: n=15 mice, YAPΔHSC: n=16 mice, αSMA-TKneg, n=10 mice, αSMA-TKpos: n=5 mice and serum ALT measurement: Yap f/f: n=6 mice, YapΔHSC: n=6 mice, αSMA-Tk neg, n=10 mice, αSMA-TKpos: n=5 mice (k) and Ki67 IHC: αSMA-TKneg, n=8 mice, αSMA-TKpos: n=4 mice (i) in non-tumoural tissues. m-n, proliferation was determined by Ki67 IHC in the tumor compartment of YapΔHSC (n=14) and Yapfl/fl (n=13) (m) as well as DTRpos (n=9) and DTRneg (n=5) mice (n). Data are shown as mean ± SEM, each data point represents one individual (e-g), all scale bars: 100 mm NT: Non-tumour, Tu: Tumour. Data are shown as mean ± SEM, each data point (a-d) as well as the HSC-fibroblast percentage quantification (e) represents one individual, in d each dot represent one gen, all scale bars: 100 mm. Statistics: all data displayed in graph dotplots besides ALT measured in αSMA-TKneg and αSMA-TKpos in k were analysed by two-tailed Student’s t-test. ALT in αSMA-TKneg and αSMA-TKpos in k were analysed by two-tailed Mann-Whitney test. Raw data are given in Source Data.
