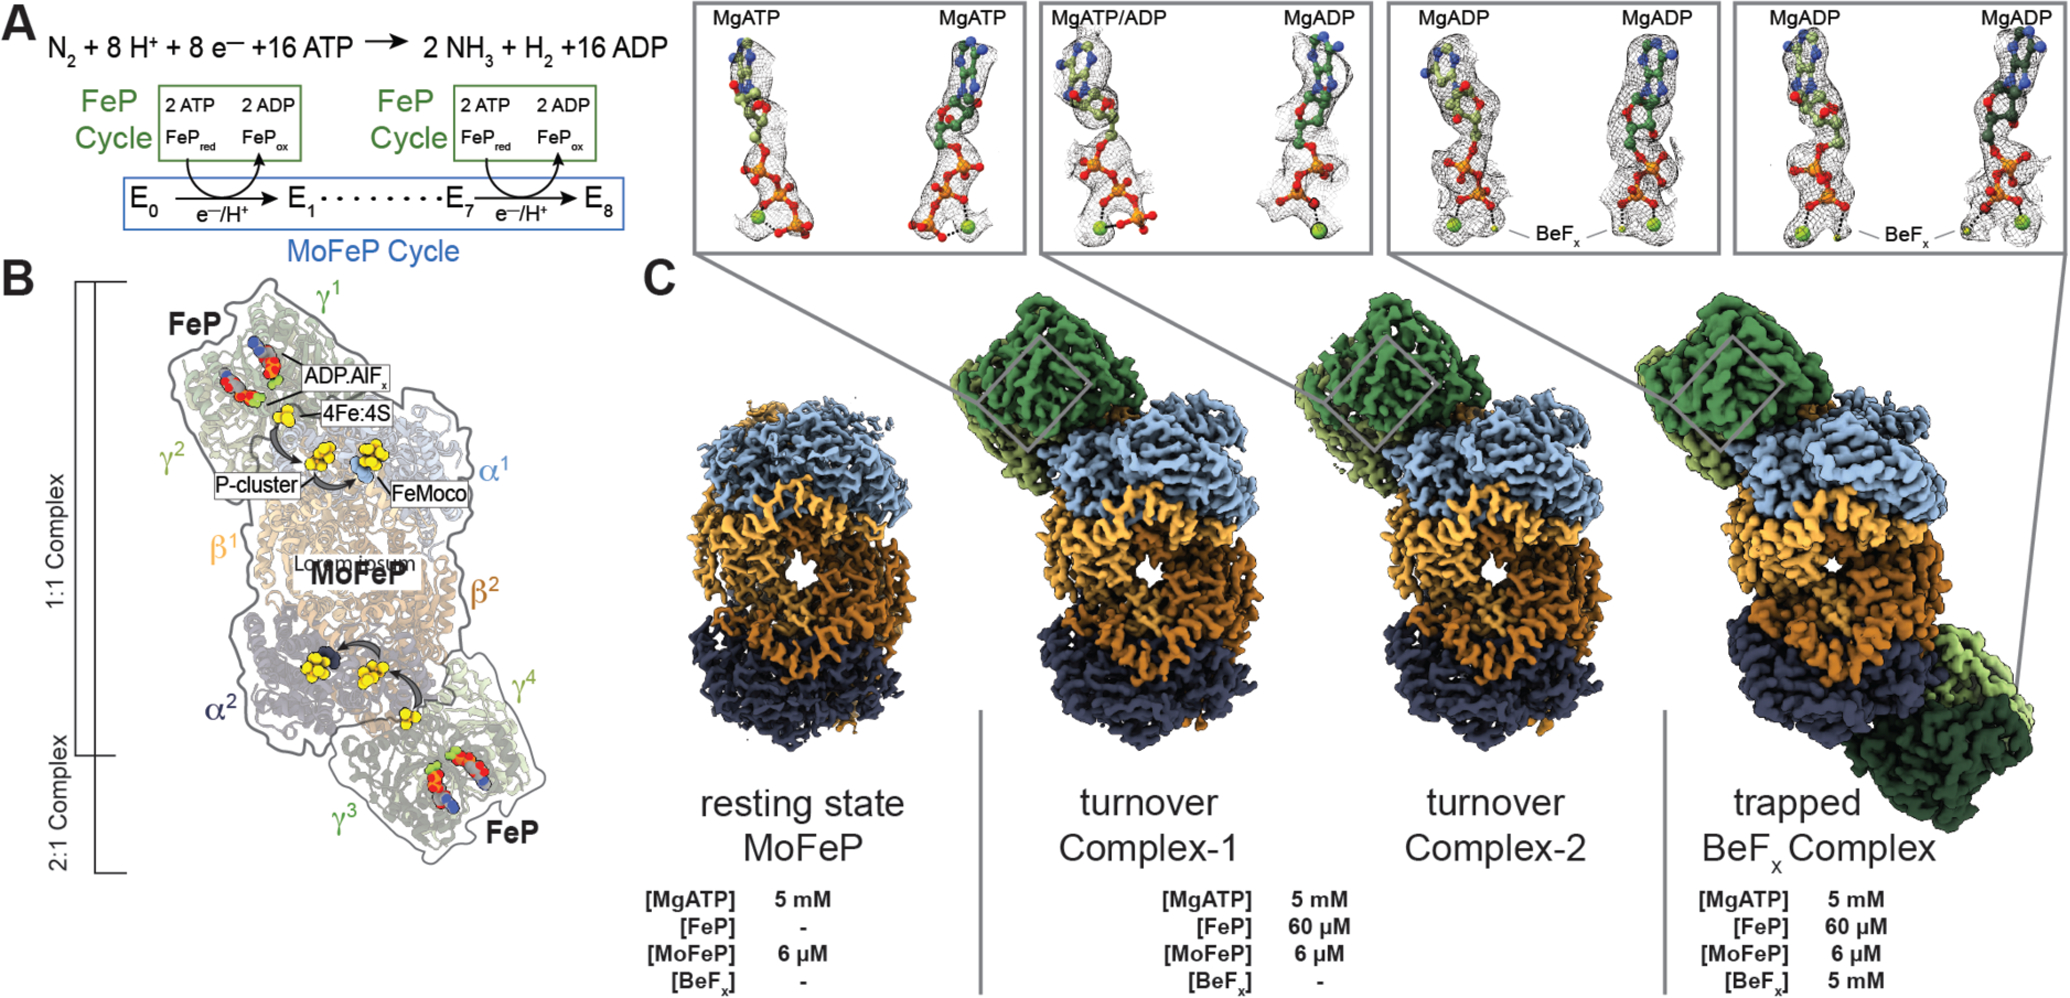
Fig. 1. Catalytic cycle for nitrogenase and its structural characterization under non-turnover and turnover conditions.

(A) Chemical reaction catalyzed by nitrogenase. There are eight FeP cycles in each MoFeP cycle. (B) Crystal structure (PDB ID: 1M34) (10) of the 2:1 FeP:MoFeP complex stabilized by MgADP.AlFx, showing the relative positions of the individual FeP (γ1 and γ2 and γ3 and γ4) and MoFeP (α1β1α2β2) subunits, the nucleotides, and the metalloclusters. The FeP subunits are shown in dark green (γ1 or γ3) and light green (γ2 or γ4), and the MoFeP subunits are highlighted in light blue (α1), dark blue (α2), light orange (β1) and dark orange (β2). Black arrows indicate the path of electron flow. (C) CryoEM maps of resting state MoFeP (rsMoFeP; ~1.8 Å resolution) obtained in the absence of FeP, and the turnover Complex-1 (t/oComplex-1; ~2.3 Å resolution) and turnover Complex-2 (t/oComplex-2; ~2.3 Å resolution) obtained under turnover conditions, and BeFx trapped FeP-MoFeP complex (~2.4 Å resolution). Coloring scheme for the subunits is the same as in (B). CryoEM maps for nucleotides are shown as a gray mesh and contoured at the following levels: rsMoFeP – 0.008, t/oComplex-1 – 0.17, t/oComplex-2 – 0.075. Magnified views of the nucleotides bound to the nitrogenase complexes and their corresponding cryoEM densities are shown in boxes.
