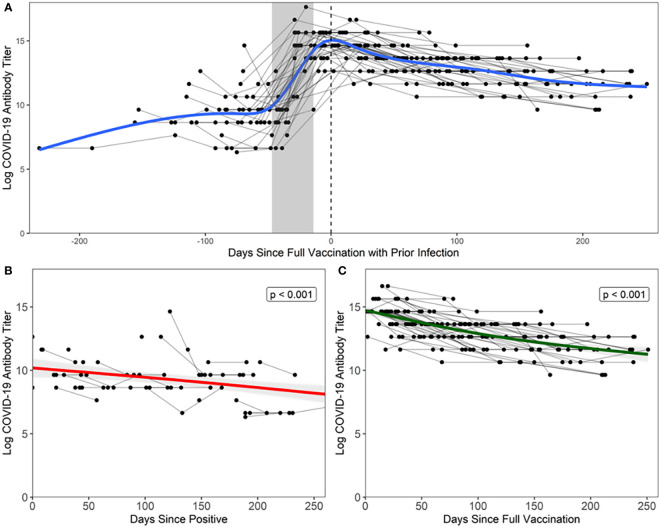
Figure 1.
Antibody response following natural infection and vaccination Each black point represents a sample from a participant, grey lines connect points from the same participant, and the grey shaded area represents the maximum number of days between doses relative to date of full vaccination (14 days after second dose, regardless of vaccine manufacturer). (A) Days since full vaccination vs. log titers over time. t=0 on the x-axis represents the day when COVID+ participants became fully vaccinated (2 weeks after second vaccination). Bi-phasic, generalized additive model (GAM) is visualized by a blue line. (B) In unvaccinated COVID+ participants, log2 antibody titers decay at a rate of -0.010 per day after last positive COVID-19 test result. Fitted linear model is visualized by a red line. Note that three points were excluded from the above figure due to the temporal scale used to graphically depict the data but are included in the analyses herein. (C) In vaccinated COVID+ participants, log2 antibody titers decay at a rate of -0.015 per day after full vaccination. Fitted linear model is visualized by a green line.

