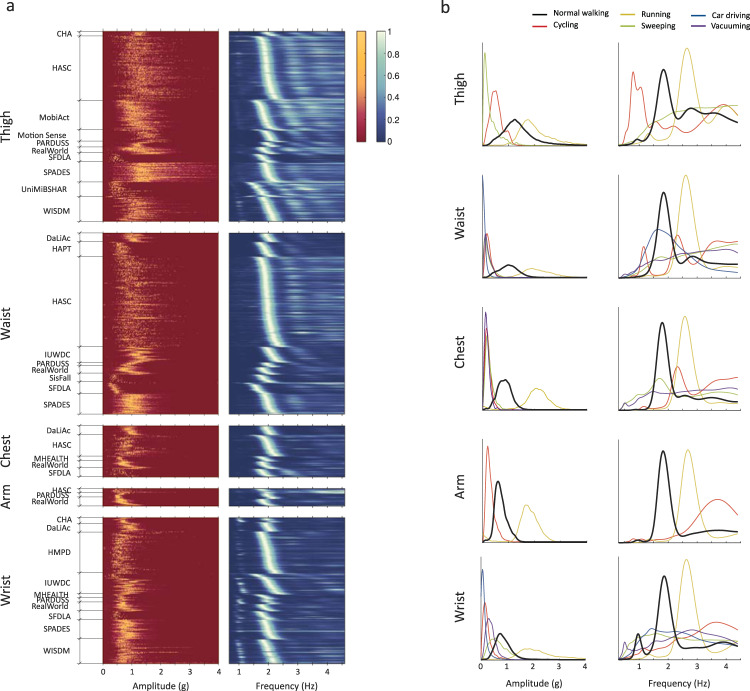
Fig. 4. Exploratory data analysis.
a Distribution of accelerometer-based signal features (peak-to-peak amplitude and wavelet coefficients) for various sensor body locations and studies during normal walking. Each row corresponds to a subject while color intensity corresponds to the frequency of a given value for this subject. In each study, subjects were sorted by the location of maximum wavelet coefficient between 1.4 Hz and 2.3 Hz. b Cumulative cross-study distribution of peak-to-peak amplitude and wavelet coefficients for normal walking and other common daily activities for various sensor body locations. Distributions were normalized to have equal area under the curve. Distributions reveal that amplitude- and frequency-based features are well suited to separate walking from other activities. They also reveal visual differences between frequency-based features at locations typical to smartphone (thigh, waist, chest, arm) and smartwatch (wrist).

