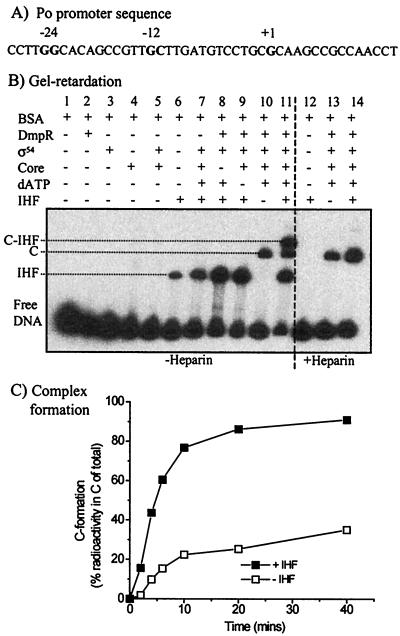
FIG. 7.
Complex formation. (A) Sequence of the Po promoter region, with the −24, −12, and +1 positions shown in bold. The sequence up to and including the first T(U) nucleotide downstream of the initiation site is shown; this sequence defines the maximum length of the nascent transcript under the conditions used to obtain the experimental results shown in panels B and C. (B) Complexes formed using the NotI fragment from pVI594 (bp −206 to +67) in the presence of the indicated supplements, as well as in the absence (left side) or presence (right side) of heparin. The labeled complexes are discussed in the text. (C) Effect of IHF on C formation over time. The complexes were generated under the conditions shown for panel B, lanes 13 (no IHF) and 14 (20 nM IHF). C, nucleoprotein complex; C-IHF, supershifted IHF-bound nucleoprotein complex; IHF, IHF-bound complex.

