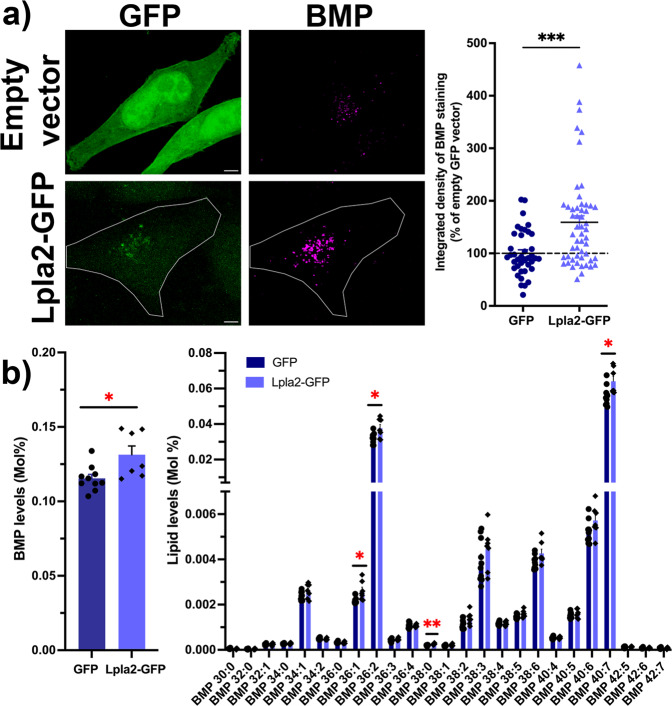
Fig. 2. Overexpression of Lpla2 results in increased BMP levels in HeLa cells.
a Left panel, representative maximum intensity projections of HeLa cells expressing Lpla2-GFP or GFP (green) immunostained for endogenous BMP (magenta). Scale bar, 5 μm. Right panel, quantification of integrated densities of BMP fluorescence signal in cells expressing Lpla2-GFP (159 ± 12%, n = 53 cells, three independent experiments) and GFP (100 ± 7%, n = 39 cells, three independent experiments). *** stands for p < 0.001 in Mann–Whitney test. b Quantification of overall BMP levels (left) and individual BMP species (right) by LC-MS/MS. Dark blue bars: GFP (n = 10 transfections); light blue bars: Lpla2-GFP (n = 7 transfections). * and ** stand for p < 0.05 and p < 0.01 in multiple unpaired t-tests with Welch’s correction, respectively. All values are given as mean ± s.e.m.

