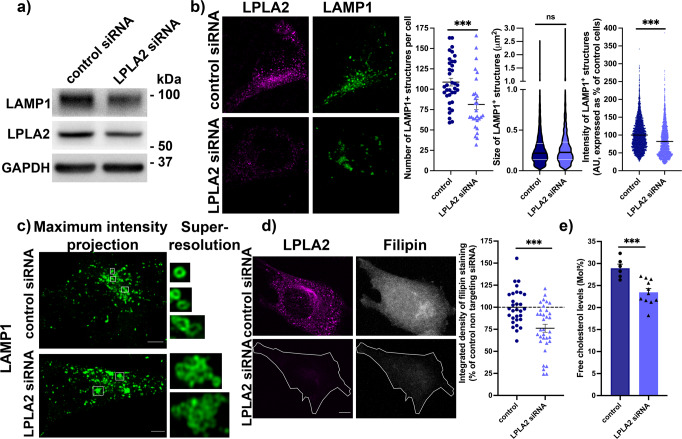
Fig. 4. Lowering LPLA2 levels leads to aberrant LE/Lys morphology and decreased cholesterol levels in HeLa cells.
a Western blot analysis of LAMP1 and LPLA2 levels of HeLa cells treated with a control non-targeting siRNA or with an siRNA targeting LPLA2. GAPDH was used as an equal loading marker. b Left panel, representative maximum intensity projections of confocal z-stacks of HeLa cells treated with a control non-targeting siRNA or with an siRNA targeting LPLA2, immunostained for endogenous LPLA2 (magenta) and LAMP1 (green). Scale bar, 5 μm. Right panel, quantification of confocal z-stacks. From left to right, scatter dot blot of the number of LAMP1-positive structures per cell in control (109 ± 5 structures, 36 cells, three independent experiments) and LPLA2 siRNA-treated cells (81 ± 6 structures, 28 cells, three independent experiments); violin plot of the size of LAMP1-positive structures in control (0.27 ± 0.003 μm2, 3914 puncta from 36 cells) and LPLA2 siRNA-treated cells (0.28 ± 0.005 μm2, 2277 puncta from 28 cells); scatter dot plot of the average fluorescence intensity of LAMP1-positive structures in control (100 ± 0.7%, 3915 puncta from 36 cells) and LPLA2 siRNA-treated cells (82 ± 0.9%, 2277 puncta from 28 cells). A.U. stands for arbitrary units, *** and ns stand for p < 0.001 and p > 0.05, respectively, in Mann–Whitney test. c Left, representative maximum intensity projections of confocal z-stacks of HeLa cells treated with a control non-targeting siRNA or with an siRNA targeting LPLA2, immunostained for endogenous LAMP1 (green). Scale bar, 5 μm. Right, representative single-section super-resolution (Airyscan) zoom-in. d Left panel, representative maximum intensity projections of HeLa cells treated with a control non-targeting siRNA or with an siRNA targeting LPLA2, immunostained for endogenous LPLA2 (magenta) and stained with filipin (gray). The cell outline is indicated by a white line in the bottom panel for clarity. Scale bar, 5 μm. Right panel, quantification of integrated densities of filipin fluorescence signals in cells treated with an siRNA targeting LPLA2 (76 ± 5%, n = 34 cells, three independent experiments) or with a control non targeting siRNA (100 ± 4%, n = 30 cells, three independent experiments). *** stands for p < 0.001 in Student’s unpaired t-test. e Quantification of free cholesterol levels by LC-MS/MS. Dark blue bars: control siRNA (n = 6 treatments); light blue bars: siRNA directed against LPLA2 (n = 11 treatments). *** stands for p < 0.001 in Student’s t-test. All values are given as mean ± s.e.m.

