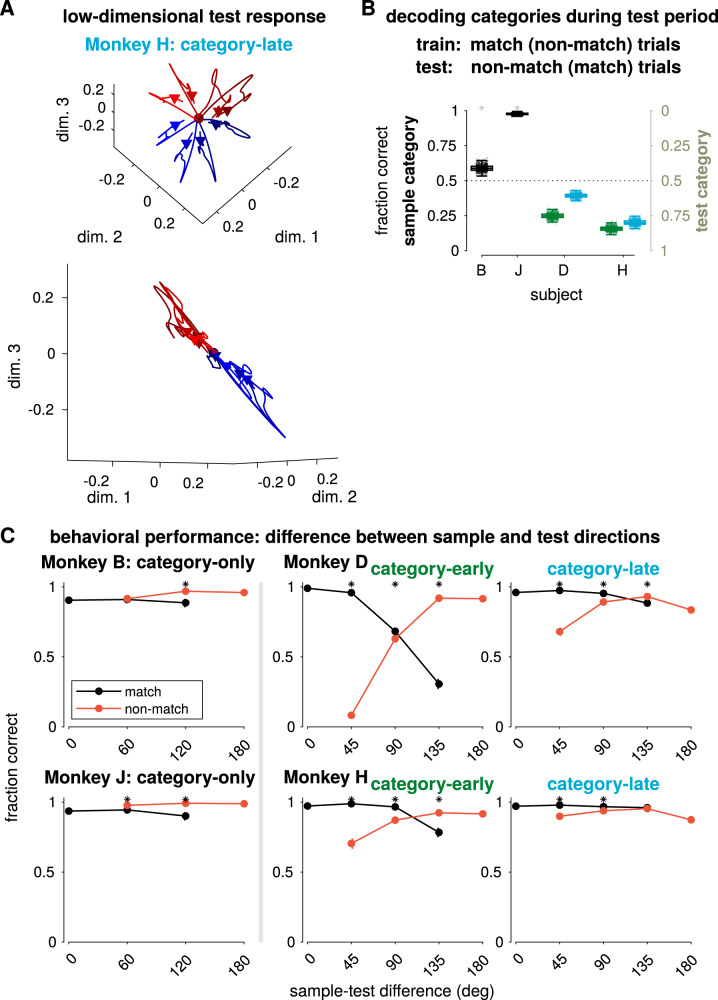
Fig. 9. Matching the test stimulus to the stored sample in the categorization task.
A The low-dimensional test stimulus-response for each direction for monkey H, category-late with the mean response removed projected into the same dimensions as in Fig. 5 (bottom right). B Decoding accuracy of sample or test category using the spike counts during the first 200 ms of the test stimulus (excluding the motor response for 95.7% of match trials). The decoder was trained on trials from all stimulus directions, but only from match (or non-match) trials and then tested on non-match (or match) trials. Performances for decoding sample and test category are mirror images (reflected over the 50% chance line): the training sets given to the binary classifiers are the same, but the test sets have opposite category labels. The box plots show the median and 25 and 75% range of decoder performance over bootstraps and the whiskers extend to a 1.5 interquartile range from the edges. All decoders generalized significantly different than chance (50%; p < 0.01 Benjamini–Hochberg corrected, two-sided bootstrap test with 1000 bootstraps of 50 trials per stimulus direction). C Average performance as a function of the difference in angle between the sample and test stimulus, sorted by match/non-match trials in the categorization task (error bars show a 99% credible interval). Asterisks indicate match and non-match are significantly different (p < 0.01, two-sided rank sum test, Benjamini–Hochberg corrected). Supplementary Fig. 14 compares the category tuning during the sample and test stimulus presentations. Supplementary Fig. 15 shows that the touch-bar subspace (encoding “match” responses) does not reflect category tuning.

