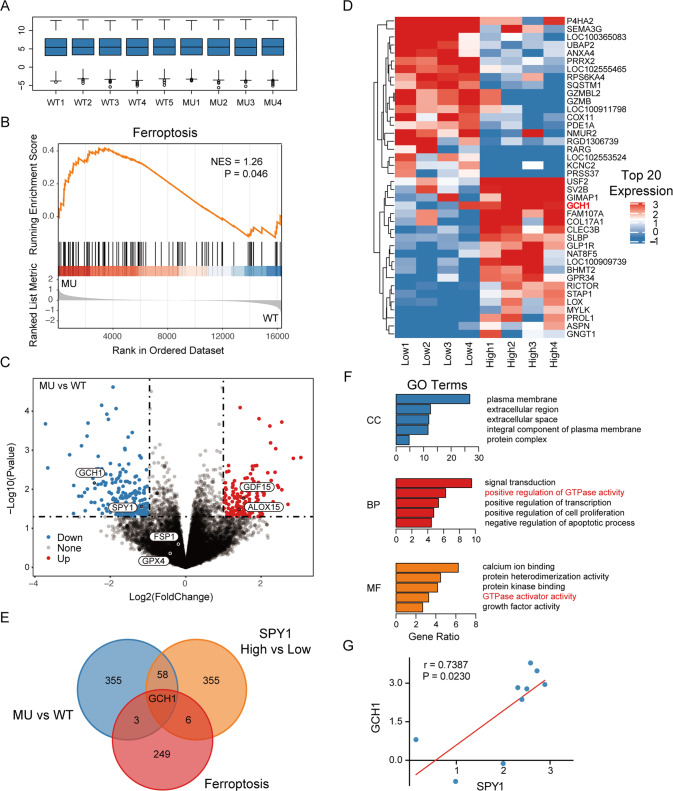
Fig. 1. The association between ALS, ferroptosis, and SPY1 is uncovered in the transcriptome data of primary rat neurons.
The transcriptome data of GSE7493 abstracted from embryonic MNs in the SOD1G93A mutant model of ALS was downloaded for analysis. A Standardization with log2 for the data, including 4 wildtypes (WT) and 5 mutants (MU). B GSEA for ferroptosis in MU vs WT (NES = 1.26, p = 0.046). C Differential expression analysis in MU vs WT containing 193 up-regulated genes and 224 down-regulated genes (p < 0.05, |logFC | ≥ 1). D The data were divided into groups of 4 lows and 4 highs based on the expression of SPY1. The heatmap exhibited the top 20 DEGs in SPY1 High vs. Low (p < 0.05, |logFC | ≥ 1). E The Venn diagram overlapped 417 DEGs in MU vs. WT, 420 DEGs in SPY1 High vs. Low, and 259 ferroptosis-related genes. F DEGs in SPY1 High vs Low were performed enrichment in the GO terms of CC, BP, and MF via David. The bar chart showed the top 5 of each term sorted by gene ratio (p < 0.05). G Pearson correlation analysis was performed on the expression of SPY1 and GCH1 (r = 0.7387, p = 0.0230). Statistical analysis by Student’s t-test.

