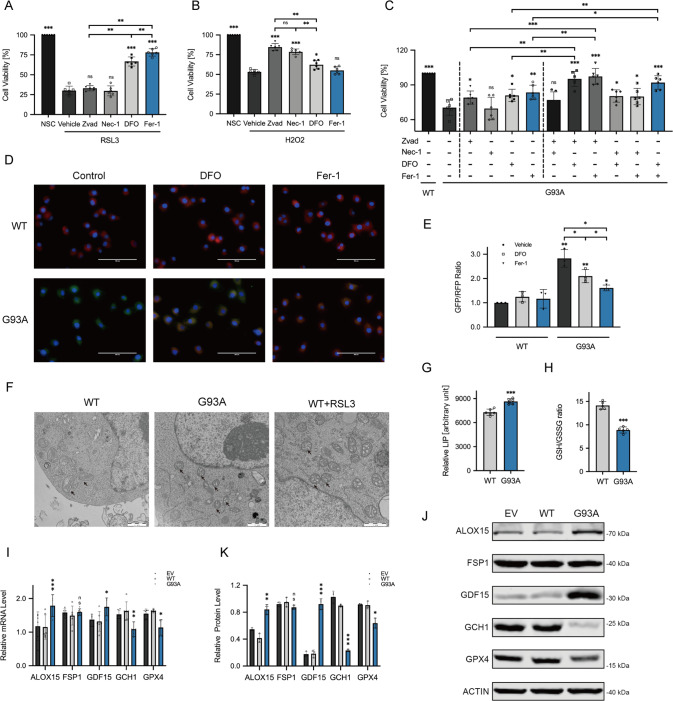
Fig. 2. Evidence of ferroptosis is found in the ALS cell model.
Cells were incubated with Zvad (20 μM), Nec-1 (50 μM), DFO (100 μM), Fer-1 (10 μM), and vehicle for 24 h. The cell viability was assessed by CCK8 assay. A The bar chart showed different inhibitors’ effects on the viability of NSC34 cells with induction of 2 μM RSL3 for 2 h (n = 6). B Different inhibitors’ effects on the oxidative stress model mediated by administration of H2O2 (200 μM) for 24 h in NSC34 cells (n = 6). C The effect of each alone or any two of four inhibitors combined on hSOD1G93A and WT cells (n = 6). D, E C11-BODIPY immunofluorescence staining was displayed in representative microscopy images. Scale bar, 100 μM. Fluorescence which shifts from red to green in response to oxidation, was quantified by the ratio of GFP (484/510 nm) to RFP (581/610 nm) using ImageJ, indicating the extent of lipid peroxidation (n = 3). F Electron microscopy images exhibited morphological changes in mitochondria. Scale bar, 1 μM. G The relative content of LIP was assessed to compare with hSOD1G93A and WT cells using Calcein-AM and DFO assay (n = 6). H The GSH and GSSG Assay Kit were used for the detection of GSH in hSOD1G93A and WT cells. The relative content was represented by the ratio of GSH/GSSG (n = 6). I The relative mRNA level of ALOX15, FSP1, GDF15, GCH1, and GPX4 in hSOD1G93A cells compared with control was measured by qRT-PCR (n = 6). J, K The protein level of ALOX15, FSP1, GDF15, GCH1 and GPX4 was tested by Western Blotting (n = 3). Values represent mean ± SD. Statistical analysis by one-way ANOVA followed by Tukey’s multiple comparisons test. *p < 0.05, **p < 0.01, ***p < 0.001.

