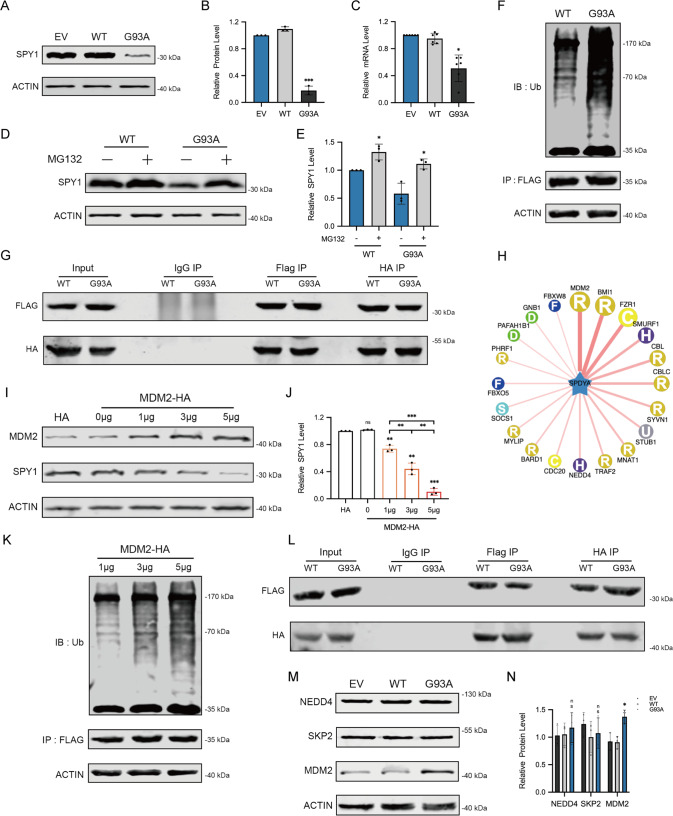
Fig. 3. The decrease of SPY1 in ALS is mediated by MDM2.
A, B Western blots and quantification for comparing the protein level of SPY1 in the cells of EV, WT, and hSOD1G93A (n = 3). C The relative mRNA level of SPY1 was assessed by qRT-PCR (n = 6). D, E MG132 (25 μM) was added into hSOD1G93A and WT cells for 6 h to evaluate the effect on expression of SPY1 (n = 3). F After transfection with SPY1-Flag for 24 h and incubation with MG132 (10 μM) for 4 h in cells of hSOD1G93A and WT, the supernatants of cell lysates were immunoprecipitated with anti-Flag and immunoblotted with anti-ubiquitin. G After transfection with SPY1-Flag and SKP2-HA for 24 h, the supernatants of cell lysates were immunoprecipitated with Flag (left) or HA (right) antibodies and immunoblotted with HA (lower panel) or Flag (upper panel) antibodies. H UbiBrowser was used to predict E3 ligase interacted with SPY1 as substrate. The prediction score of interaction was expressed from high to low by connecting lines from thick to fine. I, J Western blots and quantification for changes of SPY1 in NSC34 cells transfected with different doses of MDM2-HA (n = 3). K Alteration in ubiquitination of SPY1 with the increase of transfected MDM2. IP, anti-Flag. IB, anti-ubiquitin. L After transfection with SPY1-Flag and MDM2-HA for 24 h, immunoprecipitated with Flag (left) or HA (right) antibodies and immunoblotted with HA (lower panel) or Flag (upper panel) antibodies. M, N Western blots and quantification for NEDD4, SKP2, and MDM2 in the cells of EV, WT, and hSOD1G93A (n = 3). Values represent mean ± SD. Statistical analysis by one-way ANOVA followed by Tukey’s multiple comparisons test. *p < 0.05, **p < 0.01, ***p < 0.001.

