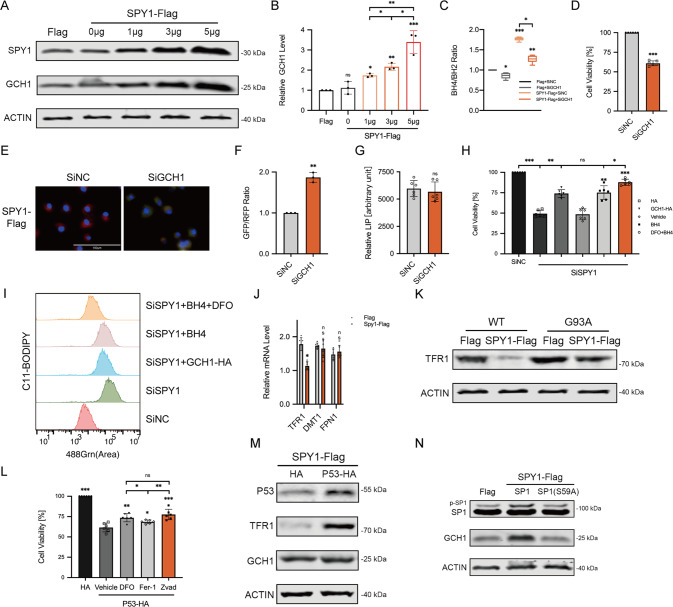
Fig. 5. SPY1 inhibits ferroptosis through regulatory of GCH1/BH4 and TFR1.
A, B Western blots and quantification for changes of GCH1 in hSOD1G93A cells transfected with different doses of SPY1-Flag (n = 3). C The effect of transfected SPY1-Flag and SiGCH1 on relative content of BH4 was shown (n = 6). D–G The effect of knockdown GCH1 on viability, lipid oxidation, and LIP in overexpressed SPY1 cells compared with control (in D and G, n = 6; in F, n = 3). Scale bar, 100 μM. H The viability was measured in SiSPY1 cells with transfected GCH1-Flag and treatment of BH4 (50 μM) and DFO (100 μM) for 24 h (n = 6). I The extent of lipid peroxidation was assessed by C11-BODIPY fluorescence staining followed by flow cytometry (channel 488). J The relative mRNA of TFR1, DMT1 and FPN1 in SPY1-Flag cells compared with control (n = 6). K Western blots for TFR1 in WT and hSOD1G93A cells with overexpressed SPY1 or control were shown. L After sequential transfection with P53-HA and control and incubation with DFO (100 μM), Fer-1 (10 μM), Zvad (20 μM), and vehicle for 24 h. The viability of SPY1-Flag cells was assessed by CCK8 assay (n = 6). M Western blots for P53, TFR1, and GCH1 in SPY1-Flag cells with overexpressed P53 and control were shown. N Western blots were shown for expression of p-SP1, SP1, and GCH1 in SPY1-Flag cells with overexpressed SP1(S59A) and wild type. Values represent mean ± SD. Statistical analysis by one-way ANOVA followed by Tukey’s multiple comparisons test. *p < 0.05, **p < 0.01, ***p < 0.001.

