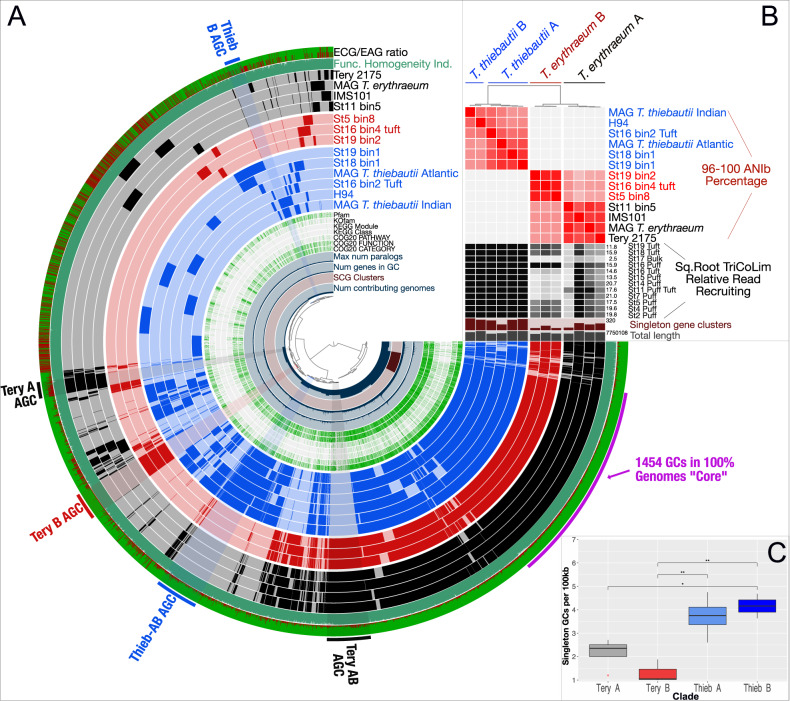
Fig. 3. N2-fixing Trichodesmium Metapangenomic visualization.
A shows blast-defined conserved gene clusters (GCs) in a MAG as filled colored rings (blue for all T. thiebautii, red for T. erythraeum B, and black for T. erythraeum A). Lighter fill colors indicate that those GCs are missing from that MAG. Singleton GCs (i.e., appearing in only one MAG) are mostly shown between 9 and 11 o’clock in the diagram. The innermost rings of the diagram indicate number of contributing genomes to a GC, single copy genes (SCG), number of genes in a GC, and max number of paralogs. Continuing outwards, if the GC has annotation it is marked in green, while if it does not it is white. The outermost two rings show whether a GC is environmentally core (green) or auxiliary (red; i.e., the redder the color, the less commonly the GC was observed in TriCoLim reads) and GC homogeneity (i.e., high homogeneity = all green fill). Clear groupings of clade specific auxiliary gene clusters (AGC) are labeled on the edge of the diagram. B shows BLAST ANI clustering at the top and the ANI heat map in red from 96 to 100. The black heat map shows square root normalized read recruiting to each MAG from TriCoLim (Blacker bars = higher relative read recruiting). C shows statistical analysis of singleton GCs per clade with ANOVA statistical support shown above the brackets (p < 0.05 = *, 0.01 = **).

