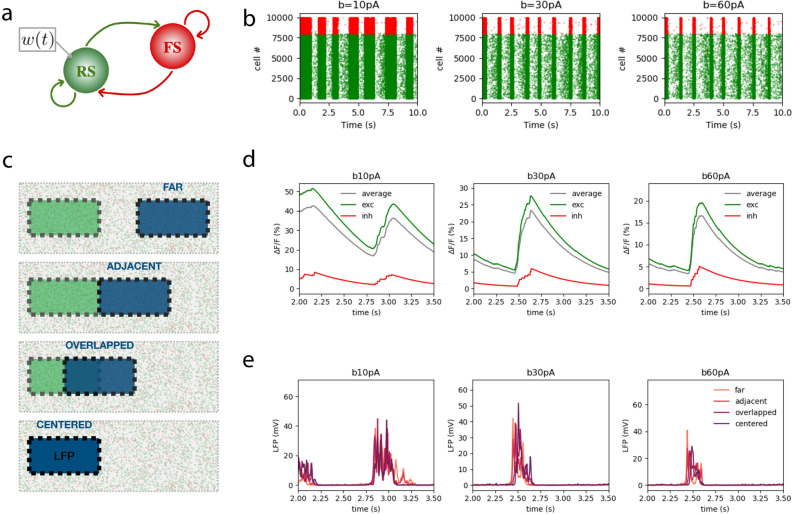
Figure 7.
Simulations of calcium and LFP signals: a. The spiking network model has two populations: one of fast spiking (FS) inhibitory neurons and another of regular spiking (RS) excitatory neurons, which are affected by adaptation (). b. Raster plots of the spikes of each population (red for inhibitory cells and green for excitatory cells) simulated under increasing adaptation strength (from left to right the strength of adaptation is and 60pA, respectively). c. 2D plane in which the 10k simulated neurons are located and position of the LFP area (blue) relative to the calcium area (FOV, green) in each condition (the distance between centers in the centered, overlapped, adjacent and far conditions are 0, 300, 600 and , respectively). Dimensions of the total area: ; FOV and LFP areas: d. Calcium signal of the excitatory (green), inhibitory (red) and average (grey) populations, simulated under increasing adaptation strength as in b. e. LFP signal in each condition in c, simulated under increasing adaptation strength as in b.

