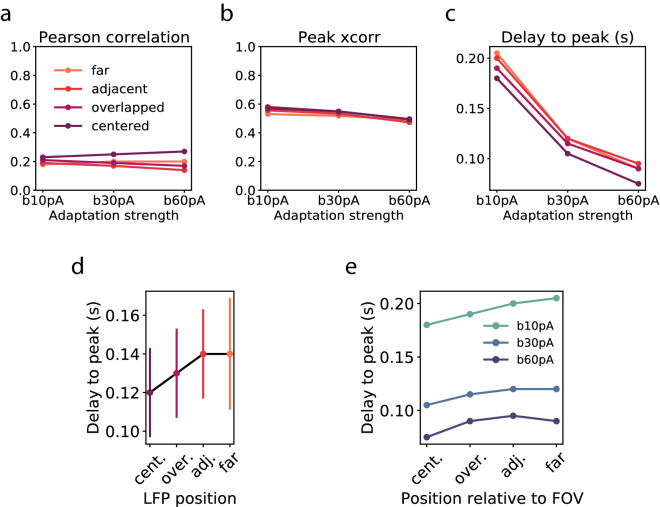
Figure 9.
Correlation between calcium and LFP for each condition. a-c. Pearson’s correlation, peak cross-correlation and delay to peak as a function of the adaptation strength. Colors indicate the condition, that is the position of the LFP area with respect to the calcium area. d. Average across different adaptation strengths of the delay to peak as a function of the condition. Error bars indicate the standard error of the mean. e. In each adaptation strength, delay to peak as a function of the condition.

