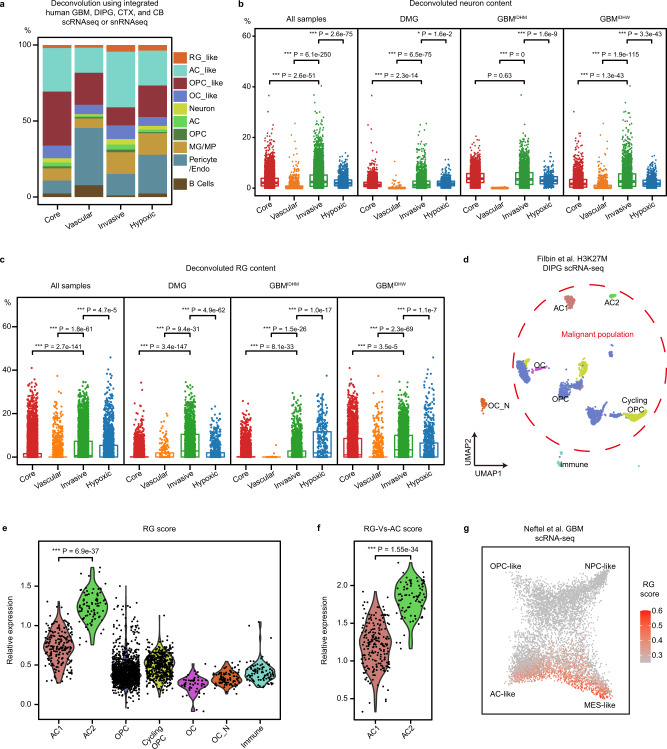
Fig. 4. Profiling ecosystems in glioma niches.
a The average of the deconvoluted percentage of individual cell types in spots from each glioma niche (n = 19,767). Integrated GBM8, DIPG6, CTX40, and CB41 public scRNA-seq datasets were used as a reference in the deconvolution analysis. b Dot plot of deconvoluted percentage of neurons in individual malignant spots from different glioma niches, quantified in all tumor samples or by tumor type (n = 10,342, 1182, 6290, and 1951 spots; n = 3917, 211, 1796, and 774 spots; n = 3713, 48, 2533, and 347 spots; n = 2712, 923, 1961, and 830 spots, respectively). Boxes indicate quartiles, horizontal bar indicates median, and whiskers indicate range, up to 1.5-fold inter-quartile range. P values, Kruskal–Wallis test for between group differences with Holm’s correction for multiple comparisons. c Dot plot of deconvoluted percentage of RG-like cells in individual malignant spots from different glioma niches, quantified in all tumor samples or by tumor type (n = 10,342, 1182, 6290, and 1951 spots; n = 3917, 211, 1796, and 774 spots; n = 3713, 48, 2533, and 347 spots; n = 2712, 923, 1961, and 830 spots, respectively). Boxes indicate quartiles, horizontal bar indicates median, and whiskers indicate range, up to 1.5-fold inter-quartile range. P values, Kruskal–Wallis test for between group differences with Holm’s correction for multiple comparisons. d Re-analysis of Filbin et al. DIPG scRNA-seq dataset6 presented by UMAP scatter plot. Cell identities for each cluster are consistent with the original study. The red-dashed circle highlights the malignant cell populations. OC_N, normal oligodendrocytes. e Violin plots of the relative RG score expression in individual cell types in d. n = 206, 87, 1437, 480, 49, 94, and 96 cells, respectively. Two tailed Wilcox test for between group differences for comparisons. f Violin plots of the relative RG-Vs-AC score expression in AC1 (n = 206 cells) and AC2 (n = 87 cells). Two tailed Wilcox test for between group differences for comparisons. g Re-analysis of Neftel et al. GBM scRNA-seq dataset7 in scatter plot showing the expression of RG score. The cellular states for each single cell were obtained from the annotations by Neftel et al7.

