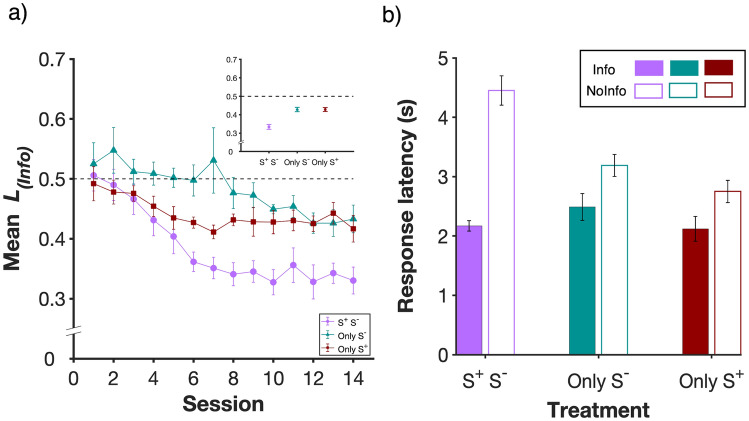
Fig. 4.
Latency to respond to Info vs NoInfo in forced (1-option) trials. a Latency-based preference index for all three treatments where L(info) = R(Info) / (R(Info) + R(NoInfo)), and R(Info) and R(NoInfo) are the median latencies to respond in Info and NoInfo, respectively. L(Info) values below 0.5 indicate preference for Info while values of L(Info) above 0.5 indicate preference for NoInfo. The inset shows data pooled over the last 3 sessions. n = 8 in each group. b Filled bars show latency to respond to Info (R(Info)) and unfilled bars show latency to respond to NoInfo (R(NoInfo)) across the three treatments (means ± s.e.m.), with data pooled from the last three sessions. n = 8 in each group

