Fig. 1.

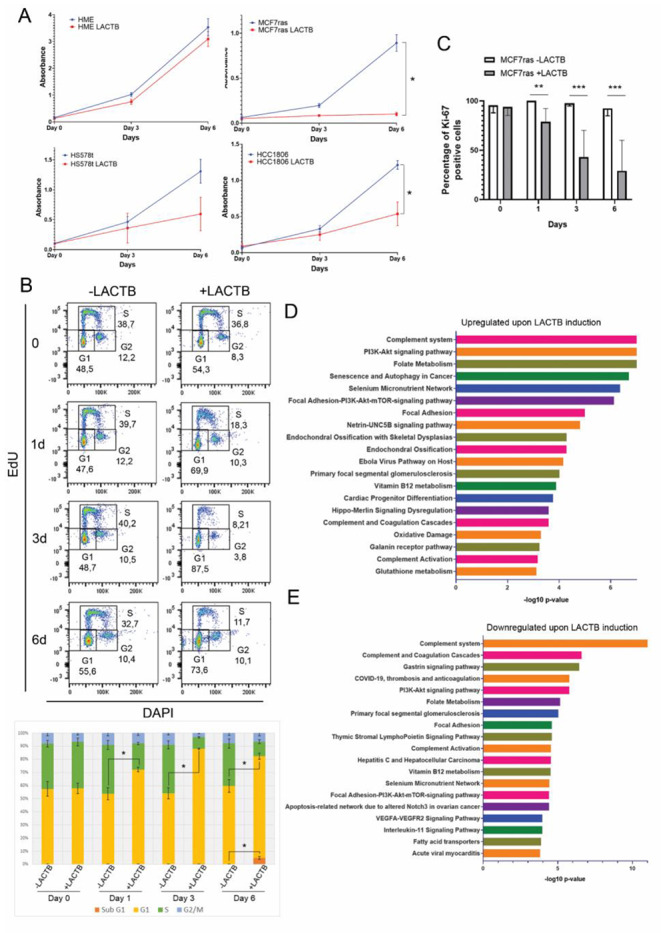
LACTB expression inhibits cancer cell growth. (A) Cell proliferation assay in HME, MCF7ras, HCC1806 and HS578t upon LACTB induction. * P < 0.05 vs. control group. (B) FACS-based cell cycle analysis of EdU/DAPI in MCF7ras cells. In the upper part, dot plots from one representative experiment are shown. In the lower part, averages from each phase of the cycle of three independent experiments are shown. * P < 0.05 vs. control group (cells not overexpressing LACTB for each time point). (C) Statistical analysis of the immunofluorescence signal for Ki-67 in MCF7ras cells. Positive cells for Ki-67 were counted and average ± SD is represented. **P < 0,01; ***P < 0,001. (D and E) Enrichment analysis performed in EnrichR and Appyiters from the protein array. Proteins 2-fold upregulated (upper graph, D) or 2-fold downregulated (lower graph, E) upon LACTB induction were considered. The 20 most significative pathways are plotted
