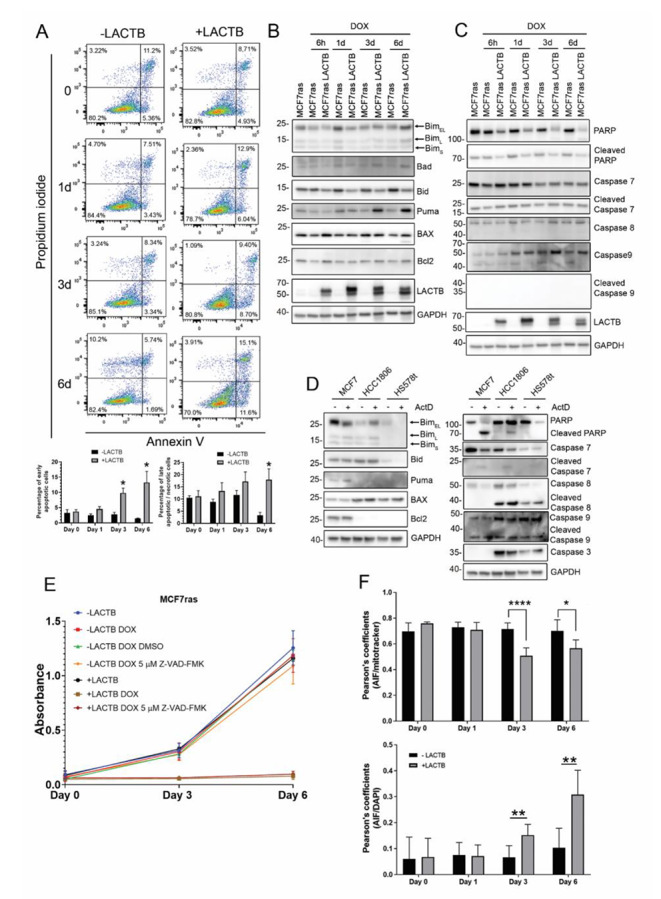
Fig. 2.

LACTB induced the intrinsic pathway of apoptosis in breast cancer cell lines. (A) Annexin V/PI analysis by flow cytometry of MCF7ras cells. LACTB was induced for the indicated time points and percentage of early apoptotic cells and late apoptotic/necrotic cells were measured by flow cytometry. Values of apoptotic ratios for each condition are presented as the mean ± standard deviation. * P < 0.05 vs. control group (-LACTB). (B) Western blot analysis of the apoptotic intrinsic pathway and the caspases levels (C) in MCF7ras overexpressing LACTB for the time points that are indicated. (D) MCF7ras, HCC1806 and HS578t cells were treated with 15 nM of actinomycin D for 24 h and protein levels were analyzed by western blot. (E) Cell proliferation assay in MCF7ras and MCF7ras where LACTB was induced. A pan-caspase inhibitor was used (5 µM Z-VAD-FMK) and proliferation was measured with AlamarBlue. (F) Pearson’s coefficient between AIF and Mitotracker (upper graph) and between AIF and DAPI (lower graph). Pearson’s coefficient was calculated with JACoP plugin in Image J. Values are represented as the mean ± standard deviation. *P < 0,05; **P < 0,01; ****P < 0,0001
