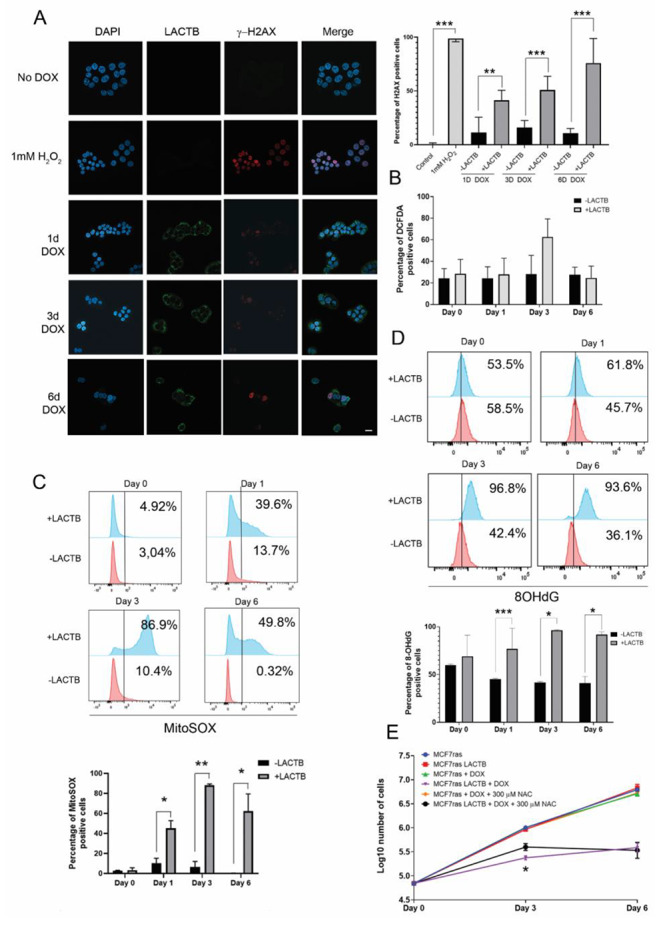
Fig. 3.

Analysis of ROS and DNA damage upon LACTB induction. (A) Immunofluorescence for γ-H2AX in MCF7ras. Images were taken with a Zeiss LSM 780 confocal microscope from a middle section of the cells. γ-H2AX-positive cells were counted, and averages ± SD from different experiments are shown on the right graph. (B) Flow cytometry analysis of general ROS production after LACTB induction. (C) Flow cytometry analysis of mitochondrial ROS superoxide by MitoSOX. (D) Flow cytometry analysis of ROS-mediated DNA damage by 8-OHdG detection. (E) Cell proliferation assay with the antioxidant NAC and LACTB overexpression. Values are represented as the average ± SD of three independent experiments. *P < 0,05; **P < 0,01; ***P < 0,001. Scale bar: 10 μm
